The electrocardiogram occupies a singular place in clinical medicine because it converts an invisible event — the electrical excitation of cardiac muscle — into a readable trace. Every contraction of the heart is preceded by a wave of depolarisation travelling through specialised conducting tissue, and the electro-cardiograph captures the resulting voltage changes at the body surface. What emerges is a repeating waveform of peaks and deflections, each labelled with a letter from P to T, and each corresponding to a specific electrical activity within the cardiac cycle. For the learner, the ECG is where the physiology of the previous lesson becomes visible: the events of systole and diastole acquire a graphical signature that can be measured, timed and interpreted.
This lesson builds directly on the cardiac cycle, heart sounds and cardiac output, treating the ECG as the electrical record of that same cyclical sequence. A standard ECG is obtained by connecting a patient to the machine with three electrical leads — one to each wrist and one to the left ankle — which continuously monitor heart activity; for detailed evaluation, multiple leads are attached to the chest region. The trace itself is read through three landmarks: the P-wave, representing electrical excitation of the atria; the QRS complex, representing depolarisation of the ventricles; and the T-wave, representing the return of the ventricles from the excited to the normal state. Because ECGs from different individuals share roughly the same shape for a given lead configuration, any deviation signals a possible abnormality or disease, which is precisely why the technique carries such clinical weight.
The material that follows works through the standard ECG in the order the ideas naturally unfold: the instrument and lead placement, the identification of each peak with its underlying electrical event, the timing relationship between the trace and the mechanical events of the cardiac cycle, and the diagnostic significance of shape. A short "Going further" block then extends the discussion with two well-established points — that depolarisation is the electrical change preceding contraction, and that counting QRS complexes over a fixed interval yields the heart rate. Throughout, the terminology, definitions and figures of the source are preserved, so that this lesson sits cleanly between the cardiac cycle behind it and the double circulation that follows.
On This Page
- The Electro-Cardiograph and the Standard ECG
- The P-Wave: Electrical Excitation of the Atria
- The QRS Complex and Ventricular Depolarisation
- The T-Wave and the Close of Systole
- Clinical Significance of Deviations from the Normal Shape
- Going Further: Depolarisation and the Counting of Beats
- Preparing for Double Circulation
The Electro-Cardiograph and the Standard ECG
The electro-cardiograph is the instrument used to obtain an electrocardiogram, and the ECG itself is defined as a graphical representation of the electrical activity of the heart during a cardiac cycle. The familiar hospital image — a patient hooked up to a monitoring machine showing voltage traces on a screen, emitting the rhythmic "pip... pip... pip" that flattens into a sustained tone during cardiac arrest — is a dramatised version of a genuinely routine diagnostic tool. What the machine records is not pressure, not sound and not flow, but voltage: the small potential differences generated by the heart's electrical activity as detected at the body surface. That distinction matters, because it separates the ECG from the stethoscope of the previous lesson, which listens to the mechanical consequences of contraction rather than the electrical cause.
Three Leads and Their Placement
To obtain a standard ECG, a patient is connected to the machine with three electrical leads: one to each wrist and one to the left ankle. These three attachments continuously monitor heart activity and together produce the familiar single trace on which the P-wave, QRS complex and T-wave are identified. The arrangement is deliberately simple, allowing the recording to be taken quickly and repeatedly without elaborate preparation. The limbs serve as convenient electrical vantage points because the heart's electrical field extends through the torso and limbs, and electrodes placed at these extremities detect the resultant voltage changes over time. The standard ECG discussed here is therefore a three-lead recording, and it is this configuration whose characteristic shape is compared across individuals.
For a detailed evaluation of the heart's function, multiple leads are attached to the chest region. This is an important qualification rather than an aside: the chest leads view the heart's electrical activity from additional angles, and a fuller assessment of cardiac function draws on that richer set of perspectives. The lesson, however, confines itself to the standard ECG, and the reader should keep that boundary in mind. Everything said about wave shapes, intervals and deviations refers to the standard three-lead recording, whose traces from different individuals are roughly the same shape for a given lead configuration. That constancy is what makes the standard ECG interpretable at all.
Reading the Trace as a Continuous Record
The ECG is a continuous record, not a snapshot. Because the leads monitor heart activity without interruption, the trace shows one cardiac cycle after another, repeating with each beat. The cyclical nature of the underlying events — the sequence of atrial and ventricular systole and diastole described in the cardiac cycle — is thus mirrored in a repeating pattern of deflections. Each peak in the ECG is identified with a letter from P to T, and that lettering corresponds to a specific electrical activity of the heart. The trace therefore functions as a timeline: the horizontal axis carries time, the vertical axis carries voltage, and the labelled peaks mark the electrical milestones within each cycle.
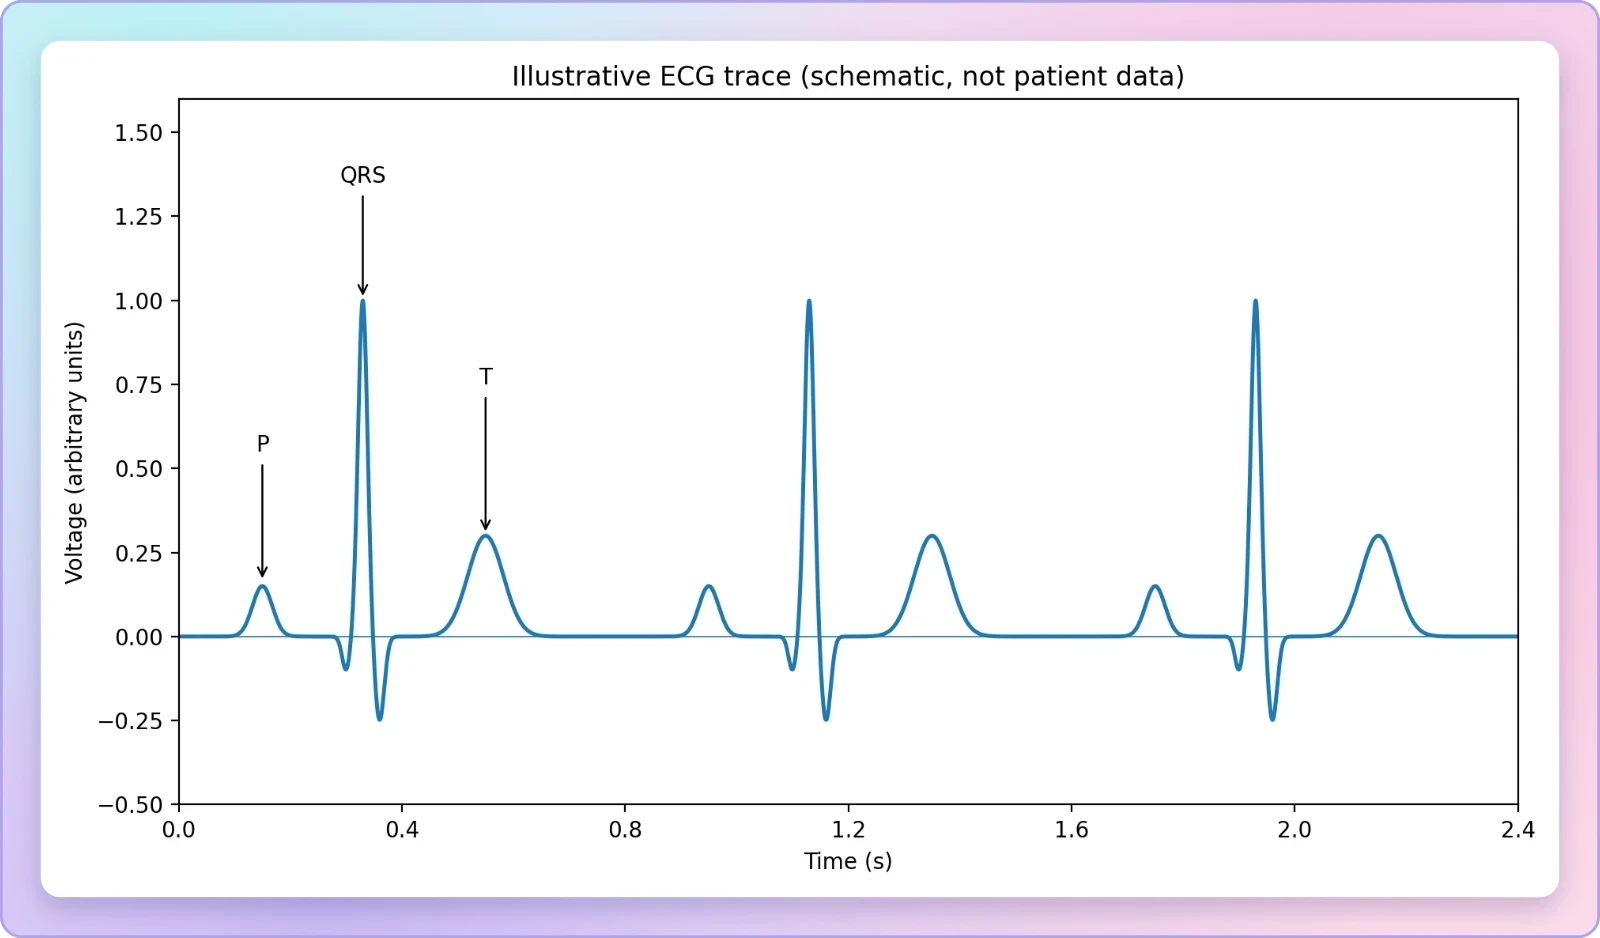
This continuous quality is what allows the ECG to serve both as a physiological illustration and as a clinical instrument. A single cycle reveals the internal ordering of atrial and ventricular events; a long strip reveals the rhythm and rate at which those cycles recur. The same recording supports both readings, which is part of the technique's economy. For the learner, the practical consequence is that the ECG should be approached as a repeating pattern to be segmented, not as an isolated curve to be memorised. Once the three landmarks are recognised, the cycle can be divided at each repetition, and the relationship between electrical events and the mechanical events of the previous lesson becomes straightforward to trace.
The P-Wave: Electrical Excitation of the Atria
The first labelled deflection in the standard trace is the P-wave, and it represents the electrical excitation — or depolarisation — of the atria. This excitation leads to the contraction of both atria. The P-wave is therefore the electrical herald of atrial systole: the wave of depolarisation spreads through atrial muscle, and the mechanical response follows. Placing the P-wave at the head of the sequence is not arbitrary but reflects the order of events in the cardiac cycle, in which the atria are activated before the ventricles. The trace thus begins, in each cycle, with the electrical signature of the atria being brought into the excited state that precedes their contraction.
Depolarisation as the Precursor of Contraction
The term depolarisation names the electrical change itself, and the material is careful to distinguish it from the contraction it produces. The P-wave represents excitation; the contraction of both atria is what that excitation leads to. This ordering — electrical event first, mechanical event second — is the organising principle of the entire ECG and explains why a voltage trace can stand in for the mechanical cycle at all. The same logic recurs in the ventricular part of the trace, where depolarisation of the ventricles initiates ventricular contraction. Once the learner grasps that the ECG records causes rather than effects, the sequence of waves ceases to be a list to memorise and becomes a narrative of activation.
Because the atria are the first structures activated in each cycle, the P-wave also serves as the natural starting marker for segmenting the trace. Everything that follows in the same cycle — the ventricular complex and the repolarisation wave — belongs to the sequence the P-wave opens. In the cardiac cycle of the previous lesson, the sequence began with the generation of a new action potential by the SAN and proceeded through atrial and ventricular events in order. The ECG gives that same sequence a visible form, with the P-wave standing at the point where atrial activation begins. Recognising this correspondence is the first step in reading the trace physiologically rather than merely descriptively.
What the P-Wave Does Not Represent
Clarity about what a wave does not represent is as valuable as clarity about what it does. The P-wave is not the record of atrial contraction itself, nor of the pressure changes that contraction produces; it is the record of the electrical excitation that leads to that contraction. Nor does the P-wave represent anything belonging to the ventricles, whose activation appears later in the cycle as the QRS complex. Keeping these boundaries firm prevents a common confusion in which the whole trace is treated as a single undifferentiated picture of the heartbeat. Each labelled peak corresponds to a specific electrical activity, and the P-wave's specific activity is atrial depolarisation and nothing else.
This precision also prepares the ground for the clinical reading developed later in the lesson. If the P-wave is understood strictly as atrial excitation, then a deviation in its shape or presence carries information about atrial electrical behaviour specifically, rather than about the heart as a whole. The same discipline applies to each subsequent landmark. The material's insistence on identifying each peak with a letter corresponding to a specific electrical activity is thus not pedantry but the foundation of interpretation. A trace read with these distinctions intact can be compared meaningfully against the roughly uniform shape expected for a given lead configuration.
The QRS Complex and Ventricular Depolarisation
The QRS complex represents the depolarisation of the ventricles, which initiates the ventricular contraction. The contraction starts shortly after Q and marks the beginning of the systole. This is the most visually prominent feature of the standard trace, and its physiological meaning is correspondingly central: it is the electrical event that sets the ventricles — the main pumping chambers — into action. The complex is named for the succession of deflections it contains, labelled Q, R and S, and the material anchors the timing of ventricular contraction to the point just after Q. With the QRS complex, the trace moves from the atrial preface into the main ventricular event of the cycle.
From Depolarisation to the Onset of Systole
The statement that contraction starts shortly after Q and marks the beginning of systole ties the electrical trace directly to the mechanical phases of the cardiac cycle. In the previous lesson, ventricular systole was described in terms of rising ventricular pressure, closure of the tricuspid and bicuspid valves, and the eventual opening of the semilunar valves. The ECG supplies the electrical trigger for that sequence. The QRS complex is thus the point at which the trace and the pressure events of the cycle can be aligned: ventricular depolarisation initiates the contraction whose mechanical consequences were already studied. This alignment is what makes the ECG useful for reasoning about the cycle as an integrated whole.
There is a small but instructive interval between the electrical event and the mechanical response — contraction starts shortly after Q, not at Q. The trace therefore leads the mechanics by a brief margin, recording the cause slightly before the effect becomes manifest. For the learner, this lag reinforces the lesson's central distinction between electrical activity and muscular contraction. It also explains why the ECG can be used to anticipate and time mechanical events: the electrical signal is the earliest reliable marker of what the ventricles are about to do. The QRS complex, in this sense, is the trace's announcement of ventricular systole.
Counting QRS Complexes to Determine Heart Rate
By counting the number of QRS complexes that occur in a given time period, one can determine the heart beat rate of an individual. This follows naturally from the fact that each QRS complex marks one ventricular depolarisation and therefore one beat. The method is simple and requires nothing beyond the trace and a known interval. It also connects the ECG back to the quantitative material of the previous lesson, where the heart was said to beat 72 times per minute and the cardiac cycle to last 0.8 seconds. A count of QRS complexes over a minute should, in a healthy individual at rest, return approximately that figure.
The relationship can be stated compactly. If ##N## QRS complexes are counted in a time interval ##t##, the heart rate in beats per minute is given by the proportion below, where the interval is expressed in seconds.
For illustration, counting 6 QRS complexes in a 5-second strip gives ##\dfrac{6}{5}\times 60 = 72## beats per minute, matching the resting rate described in the cardiac cycle. The calculation is deliberately elementary, but its diagnostic value is real: the same count performed on a longer strip reveals whether the rhythm is steady and whether the rate departs from the expected range. The QRS complex thus serves two purposes at once — it marks ventricular activation within a single cycle, and it provides the countable unit from which the rate of the whole heart is derived.
The T-Wave and the Close of Systole
The T-wave represents the return of the ventricles from the excited to the normal state, a process termed repolarisation. The end of the T-wave marks the end of systole. With this wave the electrical cycle closes: the ventricles, having been depolarised at the QRS complex and having contracted in consequence, are restored to their resting electrical condition. The trace thus brackets ventricular systole between two electrical events — the QRS complex at its opening and the end of the T-wave at its close. This bracketing is one of the most useful features of the standard ECG, because it allows the duration of systole to be read directly from the trace without any separate measurement of pressure or flow.
Repolarisation and the Restoration of the Ventricles
Repolarisation is the counterpart of depolarisation, and the material defines it plainly as the return of the ventricles from the excited to the normal state. Where the QRS complex announced the onset of ventricular activity, the T-wave announces its resolution. The pairing is instructive: the same tissue that was driven into the excited state must be restored before the next cycle can begin. In the cardiac cycle, ventricular relaxation and the falling of ventricular pressure set the stage for the reopening of the tricuspid and bicuspid valves and the refilling of the ventricles. The T-wave's completion marks the electrical side of that return to the resting condition.
It is worth noting that the T-wave concerns the ventricles specifically, just as the QRS complex does. The atrial repolarisation that must also occur is not separately labelled in the standard trace as described here, and the material does not assign it a peak. The learner should therefore resist the temptation to distribute the three landmarks evenly across all four chambers. The trace as presented is built around atrial depolarisation, ventricular depolarisation and ventricular repolarisation, and the T-wave belongs firmly to the ventricular story. Its end is the end of systole, and that single fact gives the wave its practical importance in timing the cycle.
Bracketing Systole on the Trace
Because the QRS complex initiates ventricular contraction and the end of the T-wave marks the end of systole, the interval between them corresponds to the period of ventricular systole. This gives the learner a way to locate the mechanical phases of the previous lesson on the electrical trace. The closure of the semilunar valves, which produces the second heart sound, occurs as the ventricles relax and ventricular pressure falls; the T-wave's completion sits at the electrical close of the same period. The ECG and the stethoscope thus describe the same events in different currencies — voltage and sound — and the two accounts can be laid alongside each other.
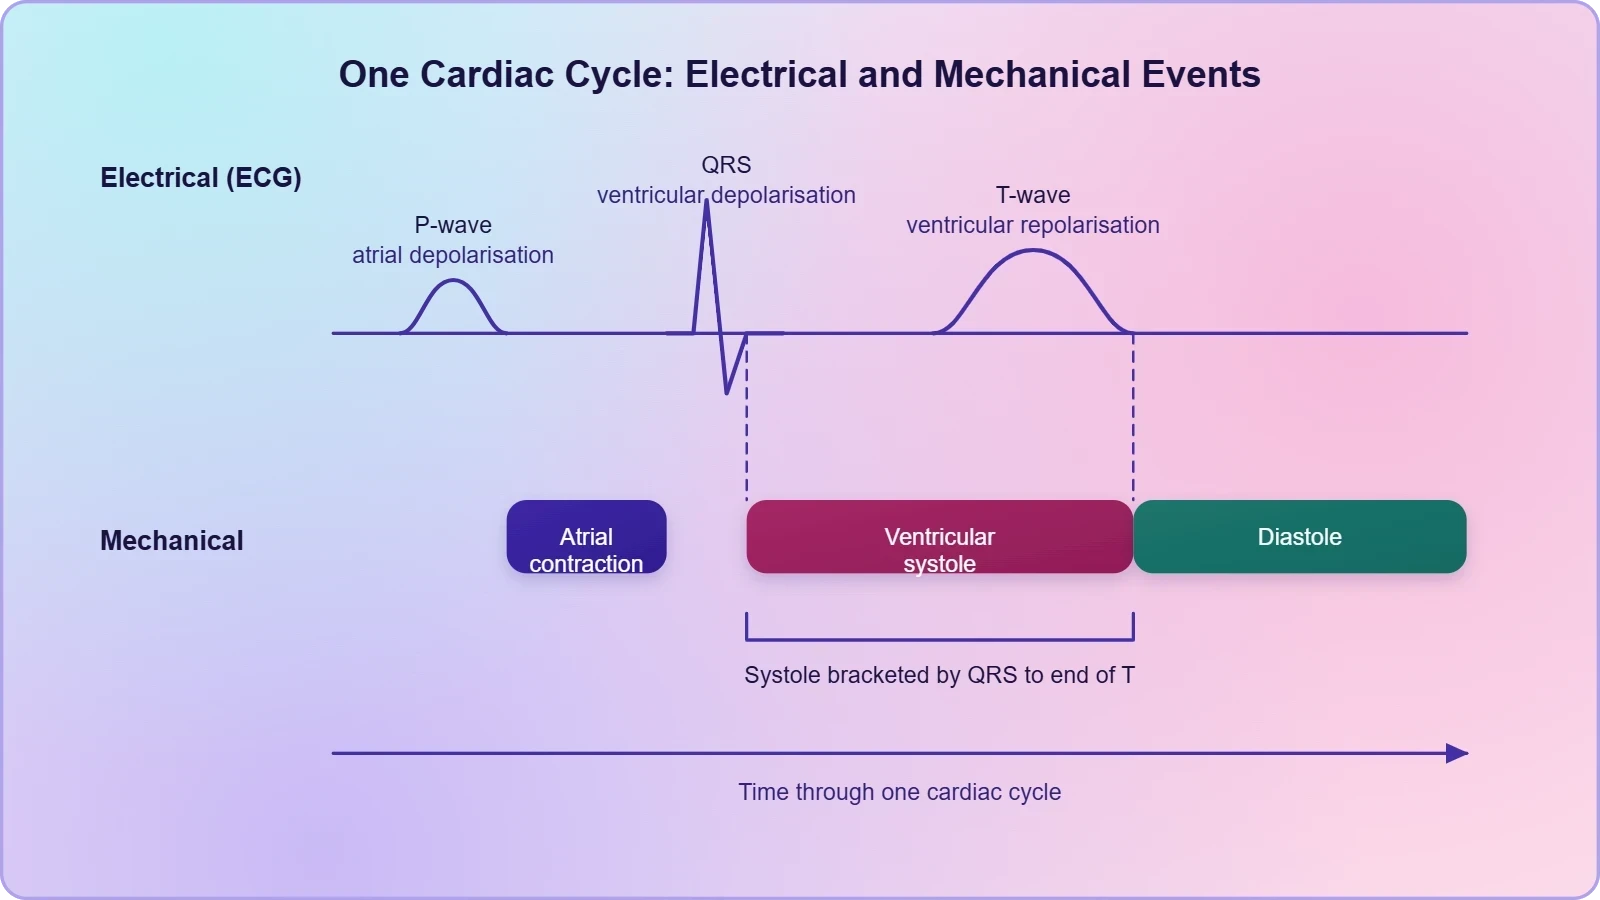
Reading systole off the trace also clarifies why the ECG is described as a representation of electrical activity during a cardiac cycle rather than of the cycle in its entirety. The mechanical events are inferred from the electrical ones, using the fixed relationship between depolarisation and contraction. That inference is reliable precisely because the relationship is consistent: contraction follows depolarisation, and relaxation follows repolarisation. The T-wave completes the trio of landmarks and closes the loop that the P-wave opened, returning the trace to the state from which the next cycle will begin.
Clinical Significance of Deviations from the Normal Shape
The clinical value of the ECG rests on a simple observation: ECGs obtained from different individuals have roughly the same shape for a given lead configuration. This uniformity is what makes the trace interpretable. Against that stable background, any deviation from the expected shape indicates a possible abnormality or disease. The material states this directly and draws the conclusion that the ECG is therefore of great clinical significance. The logic is comparative rather than absolute — the trace is not read in isolation but against a norm established across individuals for the same lead arrangement. Deviation, not the raw waveform, is the diagnostic signal.
Why a Shared Shape Makes Comparison Possible
The consistency of the standard ECG across individuals is a remarkable fact and deserves emphasis. Despite differences in body size, chest shape and heart rate, the sequence of deflections for a given lead configuration retains a recognisable form. This is what allows a clinician to speak of a normal ECG at all, and it is what allows the three landmarks — P-wave, QRS complex and T-wave — to be identified reliably in a new recording. The shared shape functions as a reference template, and the trained eye compares each new trace against it. Without that constancy, every recording would be an isolated curiosity rather than a diagnostic document.
The qualification "for a given lead configuration" is essential. The comparison is only valid when like is compared with like, which is why the lesson confines itself to the standard three-lead arrangement. The chest leads used for detailed evaluation view the heart from different positions and would produce different traces; their interpretation belongs to a fuller assessment than this lesson undertakes. Within the standard configuration, however, the uniformity is sufficient to support meaningful comparison, and the three labelled peaks provide fixed reference points against which any departure can be located and described.
Deviation as a Signal of Possible Abnormality
When the trace departs from the expected shape, the departure is read as a possible abnormality or disease. The wording is appropriately cautious: a deviation indicates a possibility, not a certainty, and the ECG is one source of evidence among several. Nevertheless, the diagnostic reach of the technique is considerable, because the trace records the electrical behaviour of the atria and ventricles in sequence. A deviation can in principle be traced to the specific electrical event whose representation has changed, which is why the lesson's insistence on assigning each peak to a specific activity pays off here. Interpretation becomes a matter of locating the anomaly within a known sequence rather than reacting to an undifferentiated irregularity.
The clinical significance of the ECG is thus inseparable from its standardisation. The instrument, the lead placement and the labelling of peaks together create a stable frame of reference; deviation from that frame carries information. This is also why the ECG can be repeated over time and compared with earlier recordings from the same individual, and why it can be set beside the recordings of others. The technique's economy — three leads, a continuous trace, three labelled landmarks — is precisely what makes it both widely used and diagnostically potent. The material's conclusion that the ECG is of great clinical significance follows directly from these properties.
Going Further: Depolarisation and the Counting of Beats
Two well-established points extend the material without altering it, and both are worth stating plainly because they sharpen the learner's grip on the trace. The first is that depolarisation is the electrical change that precedes contraction of heart muscle. The second is that counting QRS complexes in a time period gives the heart beat rate. Neither point contradicts anything in the standard account; each simply names the underlying principle more explicitly. Together they explain why the ECG works as a diagnostic instrument at all — because electrical change reliably precedes mechanical action, and because each ventricular depolarisation corresponds to exactly one beat.
The Precedence of Electrical Change
Depolarisation, understood as the electrical change that precedes contraction of heart muscle, is the physiological reason the ECG can stand in for the mechanical cycle. The trace records the electrical event; the contraction follows. This precedence is what the material describes when it says that the P-wave leads to the contraction of both atria and that ventricular depolarisation initiates ventricular contraction. Stated as a general principle, it applies across the myocardium: muscle does not contract until it has been electrically activated. The ECG therefore captures the earliest reliable sign of each contraction, which is why it is valued for timing and for detecting disturbances in the activation sequence.
This principle also clarifies the meaning of repolarisation. If depolarisation precedes contraction, then the return to the normal state marks the electrical close of the active period, and the muscle relaxes as the tissue is restored. The T-wave's role as the marker of the end of systole follows from this. The learner who holds the precedence principle in mind will find that the three landmarks are not arbitrary labels but the visible expression of a consistent physiological rule. Electrical change comes first; mechanical consequence follows; restoration closes the sequence. The trace is that rule drawn out over time.
Counting Beats and Reading the Rate
Counting QRS complexes over a known period is the practical application of the one-beat-per-complex correspondence. Because each QRS complex marks a ventricular depolarisation, and each ventricular depolarisation initiates one contraction, the count of complexes equals the count of beats. The method requires only a defined time window and a careful tally, and it yields the heart beat rate of the individual. In a healthy resting adult the result should approximate the familiar figure of 72 beats per minute, consistent with a cardiac cycle of 0.8 seconds. A rate that departs markedly from this range is itself a deviation worth noting.
The same correspondence supports a second, complementary reading: the interval between successive QRS complexes gives the duration of one cardiac cycle. If the rate is 72 beats per minute, each cycle lasts ##\dfrac{60}{72} = 0.8## seconds, exactly as the cardiac cycle material states. Rate and cycle duration are thus two views of the same measurement, and the ECG supplies both from a single strip. This is a modest but genuinely useful insight for the learner, because it links the graphical trace to the quantitative framework of the previous lesson and prepares the ground for the study of circulatory pathways that follows.
Preparing for Double Circulation
The ECG completes the electrical account of the cardiac cycle and leaves the learner ready to follow the blood itself. The previous lesson established the mechanical sequence — systole and diastole, valve closures, heart sounds and cardiac output — and this lesson has supplied the electrical record that precedes and accompanies it. What remains is the route the blood takes once the ventricles have pumped. The next lesson turns to double circulation: the vessels, the pulmonary pathway from the right ventricle through the lungs to the left atrium, and the systemic pathway from the left ventricle through the aorta to the tissues and back to the right atrium. The ECG, in this sense, closes one chapter and opens the door to the next.
From Electrical Record to Vascular Route
The transition is natural because the ECG has already identified the ventricles as the chambers whose activation drives the cycle. The QRS complex marks the depolarisation that initiates ventricular contraction, and it is the contraction of the ventricles that propels blood into the pulmonary artery and the aorta. The trace therefore points forward to the vascular pathways: the right ventricle sends deoxygenated blood into the pulmonary artery, and the left ventricle pumps oxygenated blood into the aorta. The electrical event studied here is the trigger for the flows studied next, and the two lessons together describe a single continuous process from excitation to circulation.
Keeping the sequence in view prevents the fragmentation that can occur when topics are studied in isolation. The cardiac cycle supplies the mechanical phases; the ECG supplies the electrical signature of those phases; double circulation supplies the destinations of the blood the phases propel. Each depends on the others, and the learner who holds all three in mind can move between them without losing the thread. The standard ECG, with its three labelled landmarks, is a compact summary of the electrical side of this integrated picture, and it is worth returning to as the vascular material is studied.
Consolidating the Lesson
The essential content of this lesson can be held in a short sequence. An electrocardiogram is a graphical representation of the electrical activity of the heart during a cardiac cycle, obtained with an electro-cardiograph. A standard ECG uses three electrical leads — one to each wrist and to the left ankle — while multiple chest leads serve detailed evaluation. Each peak is identified with a letter from P to T: the P-wave represents electrical excitation of the atria, the QRS complex represents depolarisation of the ventricles and initiates ventricular contraction, and the T-wave represents the return of the ventricles to the normal state, its end marking the end of systole. Counting QRS complexes gives the heart rate, and deviation from the shared shape signals possible abnormality.
Two further points deserve a final emphasis. First, the uniformity of the trace across individuals for a given lead configuration is what makes deviation meaningful; without it, the ECG could not function as a diagnostic instrument. Second, the electrical events recorded are causes rather than effects, which is why the trace can be read as a forecast of the mechanical cycle. With these principles in hand, the learner is equipped both to interpret the standard ECG and to carry the electrical understanding forward into the study of the vessels and pathways that distribute the blood the heart has pumped.
Also Read
- No links available.
From our network :
- Mastering DB2 12.1 Instance Design: A Technical Deep Dive into Modern Database ArchitectureComprehensive guide to DB2 12.1 Instance Design. Explore architectural components, HADR setup, buffer pool tuning, and security policies for IBM DB2 12.1. Includes 10 functional SQL and Shell samples.
- 98% of Global MBA Programs Now Prefer GRE Over GMAT Focus EditionExplore why 98% of global MBA programs now prefer the GRE over GMAT Focus. Learn about the shorter GRE format, verbal logic importance, and strategic versatility for students.
- EV 2.0: The Solid-State Battery Breakthrough and Global Factory ExpansionDiscover the impact of the Solid-State Battery Breakthrough on the EV market. Learn about CATL and BYD stock growth, global factory expansion in Europe, and the future of EV 2.0 technology.
- Trump Political Strategy How Geopolitical Stunts Serve As Media Diversions
- Analyzing Trump Deportation Numbers Insights Into The 2026 Immigration Crackdown
- 10 Physics Numerical Problems with Solutions for IIT JEEPrepare for IIT JEE with 10 physics numerical problems, complete with detailed solutions and conceptual explanations. Ideal for mastering kinematics, thermodynamics, electromagnetism, and optics.
- AI-Powered 'Precision Diagnostic' Replaces Standard GRE Score ReportsDiscover the new GRE Precision Diagnostic. Learn how AI-powered behavioral analytics and time-to-solve tracking are replacing standard GRE score reports to empower students.
- Mastering DB2 LUW v12 Tables: A Comprehensive Technical GuideComprehensive guide on DB2 LUW v12 tables. Explore CREATE TABLE syntax, BLU Acceleration, range partitioning, data types, and security features for IBM DB2 LUW v12.
- Vite 6/7 'Cold Start' Regression in Massive Module GraphsIn-depth analysis of Vite 6/7 cold start regressions in massive module graphs. Learn about barrel file issues, pre-bundling optimizations, and how to improve Vite dev server performance.
RESOURCES
- Conquering the ECG - Cardiology Explained - NCBI Bookshelf - NIHncbi.nlm.nih.govT wave. T waves represent ventricular repolarization (atrial repolarization is obscured by the large QRS complex). Wave direction and size. Since the ...
- Normal Electrocardiography (ECG) Intervals - Medscapeemedicine.medscape.comJun 19, 2026 ... ... P, QRS, and T-wave complexes. Normal ECG values for waves and ... Ventricular depolarization and subsequent repolarization lead to…
- Electrocardiogram - StatPearls - NCBI Bookshelf - NIHncbi.nlm.nih.govFigure 1. Normal ECG showing P waves (green arrows), QRS complex (blue arrows), and T waves (red arrows) Contributed by Y Sattar, MD. Figure…
- Frequency Content and Characteristics of Ventricular Conductionpmc.ncbi.nlm.nih.govDifferences in the speed of wavefront propagation through the cardiac cycle are reflected by different frequencies content of ECG waves. The content of T…
- ECG interpretation: Characteristics of the normal ECG (P-wave, QRS ...ecgwaves.comIt is measured from the onset of the QRS complex to the end of the T-wave. The QT duration is inversely related to heart…
- Electrocardiogram (EKG, ECG) - Cardiovascular Physiology Conceptscvphysiology.comElectrocardiogram (EKG, ECG) · General Description · P wave (atrial depolarization) · QRS complex (ventricular depolarization) · ST segment · T and U waves…
- PQRST Wave Explained: ECG Interpretation Made Easy for Beginnersadvancedmedicalcertification.comJan 31, 2025 ... PQRST Wave: What a Normal EKG Strip Means · The Types of Waves Seen in an EKG · How PQRST…
- Electrocardiography - Wikipediaen.wikipedia.orgThe QRS complex, which represents depolarization of the ventricles; The T wave, which represents repolarization of the ventricles. During each heartbeat, a ...
- Multi-component based cross correlation beat detection in ...link.springer.comJul 23, 2004 ... ... wave in addition to onset and offset markers for 3000 cardiac cycles ... P wave, QRS complex and T…
- A novel and lightweight P, QRS, and T peaks detector using ...sciencedirect.comAn electrocardiogram (ECG) comprises sequential waves, namely the P, QRS, and T waves, which occur in each cardiac cycle [1]. ... T waves, not…
- In-ear ECG Signal Enhancement with Denoising Convolutional ...arxiv.orgAug 27, 2024 ... ... ECG template. Channel 6 captures more T-wave information, while Channel 10 concentrates on the P-wave and QRS complex. This…
- 19.2 Cardiac Muscle and Electrical Activity - Anatomy ... - OpenStaxopenstax.orgApr 20, 2022 ... Relate characteristics of an electrocardiogram to events in the cardiac cycle ... There are five prominent points on the ECG:…
- 15.3: How the Heart Produces Pressure and Flow - Biology LibreTextsbio.libretexts.orgAug 30, 2026 ... ECG waveform labels the P wave, QRS complex, T wave, PR interval,. Figure 15.15 ECG Tracing. An electrocardiogram (ECG) records…
- biometric.shtml - ECG-ID Database - PhysioNetphysionet.orgObviously, information about cardiac electrical activity is primarily contained in the cardiac cycle fragment containing the QRS complex, P and T waves ...
- Snohomish County Fire District 4's post - Facebookfacebook.comDec 12, 2024 ... T wave = ventricular repolarization This prepares the myocardium for the next cardiac cycle. ... P wave is followed by…