The cardiac cycle is the rhythmic sequence of contraction and relaxation that keeps blood moving through the heart, and understanding it transforms a static anatomical diagram into a living, working pump. Every beat you feel in your chest represents a precisely choreographed series of pressure changes, valve movements and chamber contractions that repeat roughly seventy-two times each minute. This lesson traces that sequence from the moment all four chambers rest together through atrial contraction, ventricular contraction and ventricular relaxation, showing how each phase sets up the next with mechanical inevitability. Along the way, we examine the two heart sounds that a stethoscope reveals and the arithmetic that connects a single heartbeat to the volume of blood your body circulates every minute.
Building on the structural foundation of the heart, its valves and its nodal tissue, this lesson focuses on function rather than anatomy. The sino-atrial node, already established as the pacemaker, now becomes the trigger that launches each cycle, while the atrioventricular node and bundle of His carry the electrical signal to the ventricular muscle. What matters here is timing: which valves are open, which are closed, where the pressure is rising and where it is falling. By the end, you will be able to narrate a complete cardiac cycle in order, explain why the two heart sounds occur when they do, and calculate cardiac output from stroke volume and heart rate.
The material also introduces the clinical dimension of these events. Heart sounds are not merely interesting acoustics; they are diagnostic signals, and their timing tells a physician which valves are closing and whether that closure is normal. Stroke volume and cardiac output, meanwhile, are the quantitative language of cardiovascular performance, and the body adjusts both to meet changing demands. An athlete's heart and a sedentary person's heart may beat at different rates and eject different volumes, yet both serve the same physiological purpose. This lesson keeps the terminology, definitions and numerical values of the source material intact while adding a short "Going further" block where well-established background helps the ideas settle.
On This Page
- The Cardiac Cycle as a Cyclically Repeated Sequence
- Timing the Cycle: Duration and the Pacemaker's Rhythm
- Stroke Volume and Cardiac Output
- The Two Heart Sounds: Lub and Dub
- Pressure Gradients as the Engine of the Cycle
- Going Further: Context That Deepens the Lesson
- Consolidating the Cycle: A Worked Narrative
The Cardiac Cycle as a Cyclically Repeated Sequence
The cardiac cycle is defined as the sequential event in the heart which is cyclically repeated, and it consists of systole and diastole of both the atria and the ventricles. Systole means contraction and diastole means relaxation, so a single cycle contains four functional phases: joint diastole, atrial systole, ventricular systole and ventricular diastole. Because the heart beats about seventy-two times per minute, that many cardiac cycles are performed each minute, and the duration of one cycle follows directly from the rate. The cycle is continuous rather than a series of separate events, with each phase creating the pressure conditions that trigger the next.
From Joint Diastole to Atrial Systole
To begin with, all four chambers of the heart are in a relaxed state, described as joint diastole. As the tricuspid and bicuspid valves are open, blood from the pulmonary veins and vena cava flows into the left and the right ventricle respectively through the left and right atria. The semilunar valves are closed at this stage, so blood entering the ventricles cannot yet leave them. This passive filling does most of the work of loading the ventricles, and it depends entirely on the one-way valve arrangement established in the previous lesson. The chambers are quiet, the valves are positioned, and the heart is primed for the next electrical impulse.
The sino-atrial node now generates an action potential which stimulates both atria to undergo a simultaneous contraction, the atrial systole. This contraction increases the flow of blood into the ventricles by about thirty per cent, completing ventricular filling rather than initiating it. The action potential is then conducted to the ventricular side by the atrioventricular node and the atrioventricular bundle, from where the bundle of His transmits it through the entire ventricular musculature. This conduction pathway ensures that the atria and ventricles contract in the correct order, with a brief delay that allows the atria to finish emptying before the ventricles begin to squeeze.
Ventricular Systole and Ventricular Diastole
The conducted impulse causes the ventricular muscles to contract, which is ventricular systole, while the atria undergo relaxation, or diastole, coinciding with the ventricular systole. Ventricular systole increases the ventricular pressure, causing the closure of the tricuspid and bicuspid valves due to the attempted backflow of blood into the atria. As the ventricular pressure increases further, the semilunar valves guarding the pulmonary artery on the right side and the aorta on the left side are forced open, allowing the blood in the ventricles to flow through these vessels into the circulatory pathways. Pressure, not intention, drives every valve movement in this sequence.
The ventricles now relax in ventricular diastole, and the ventricular pressure falls, causing the closure of the semilunar valves, which prevents the backflow of blood into the ventricles. As the ventricular pressure declines further, the tricuspid and bicuspid valves are pushed open by the pressure in the atria exerted by the blood which was being emptied into them by the veins. Blood now once again moves freely to the ventricles, and the ventricles and atria are once again in a relaxed state of joint diastole, exactly as at the beginning. Soon the sino-atrial node generates a new action potential, and the events repeat in that same sequence indefinitely.
Timing the Cycle: Duration and the Pacemaker's Rhythm
The duration of a cardiac cycle is not an arbitrary figure; it is deduced directly from the heart rate. Because the heart beats seventy-two times per minute, seventy-two cardiac cycles are completed in sixty seconds, and dividing sixty by seventy-two yields a cycle length of 0.8 seconds. This single number anchors the entire lesson, because every phase described above must fit within that window. The sino-atrial node, which can generate the maximum number of action potentials at seventy to seventy-five per minute, sets the tempo, and its autoexcitable nature means the rhythm originates within the heart itself rather than from any external stimulus.
Why 0.8 Seconds Matters
Knowing that one cycle lasts 0.8 seconds allows you to appreciate why the phases overlap rather than follow one another as discrete blocks. Atrial systole occupies only a fraction of the cycle, ventricular systole a larger fraction, and the remainder is shared relaxation. The brief conduction delay at the atrioventricular node, transmitted onward by the bundle of His and Purkinje fibres, is what prevents the atria and ventricles from contracting simultaneously. Without that delay, ventricular filling would be compromised and the pump would be far less efficient. The timing is therefore as important as the contraction itself.
The pacemaker's rate is not fixed for life, and the nodal musculature's ability to generate action potentials without external stimuli does not mean the rate is unvarying. Different parts of the nodal system generate action potentials at different rates, with the sino-atrial node dominating precisely because it fires fastest. This hierarchy of firing rates provides a safety net: should the primary pacemaker falter, slower regions can assume a rhythm, though at a reduced rate. For this lesson, the essential point is that the normal seventy to seventy-five beats per minute establish the 0.8-second cycle on which all calculations rest.
Relating Cycle Length to Rate
The relationship between cycle duration and heart rate is a simple reciprocal one, and expressing it formally clarifies the arithmetic. If the heart rate is ##f## beats per minute, the duration of one cycle in seconds is given by the reciprocal of the rate expressed per second. This is the kind of dimensional reasoning that appears throughout physiology, and it rewards a moment of reflection.
Substituting the standard rate of seventy-two beats per minute gives a cycle duration of 0.8 seconds, matching the value stated in the material. The same relationship can be rearranged to find the rate from a measured cycle length, which is precisely what an electrocardiogram allows a clinician to do by measuring the interval between successive beats. The next lesson takes up that graphical record in detail, but the arithmetic established here provides the bridge between the electrical trace and the mechanical events it represents.
Stroke Volume and Cardiac Output
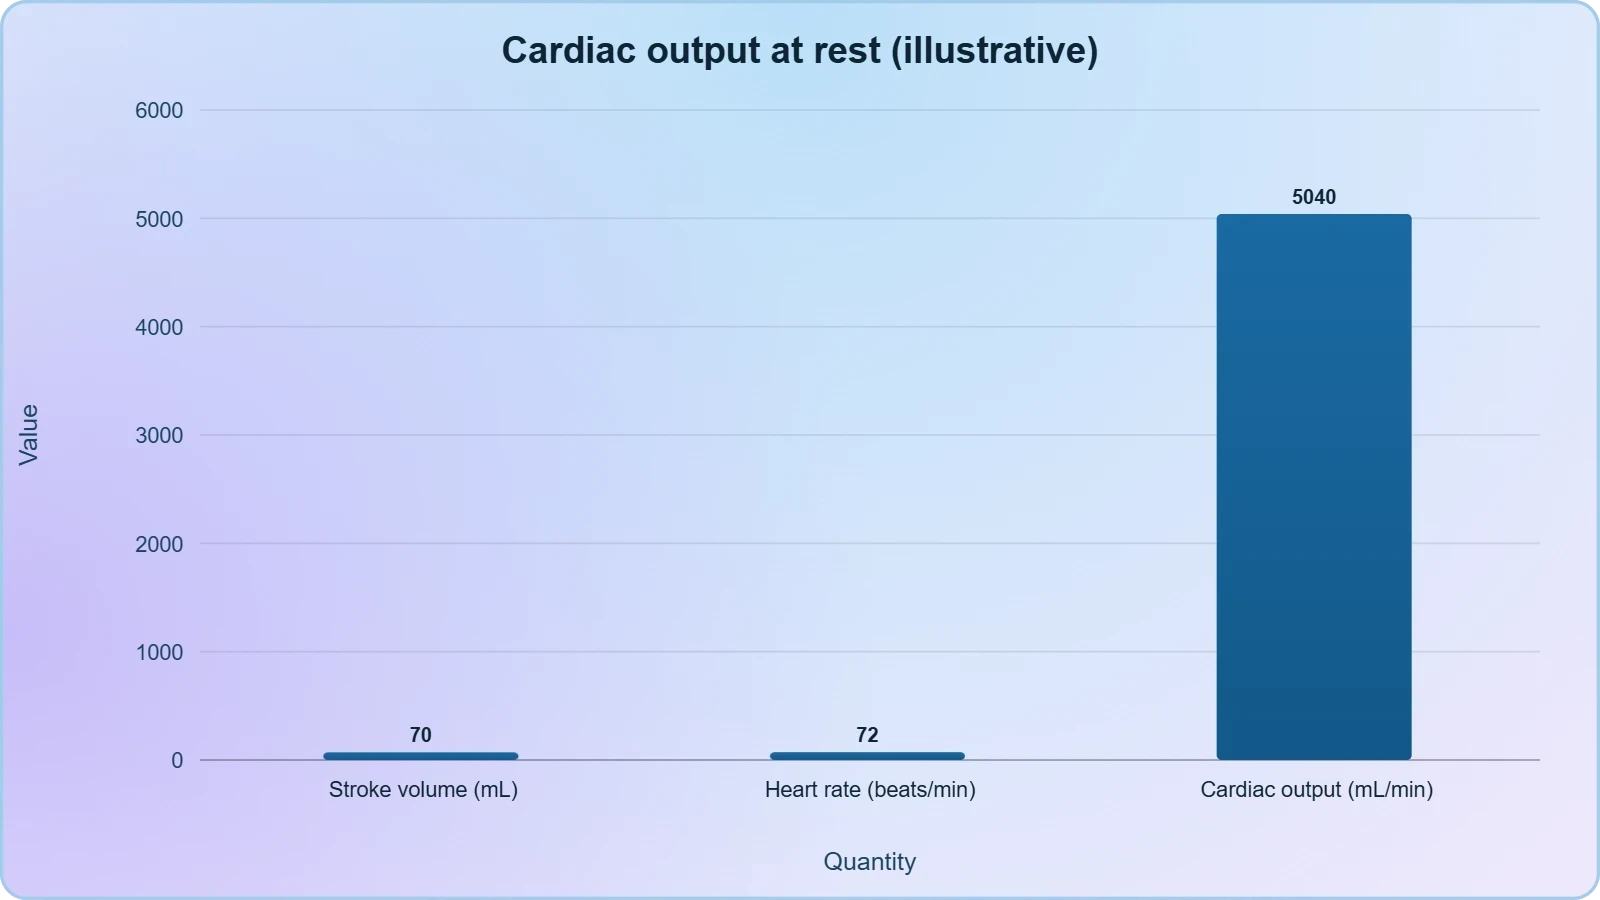
During a cardiac cycle, each ventricle pumps out approximately seventy millilitres of blood, and this quantity is called the stroke volume. Stroke volume is a per-beat measure, describing what a single contraction ejects, and it applies to each ventricle independently even though both contract together. The stroke volume multiplied by the heart rate, meaning the number of beats per minute, gives the cardiac output. Cardiac output can therefore be defined as the volume of blood pumped out by each ventricle per minute, and it averages five thousand millilitres, or five litres, in a healthy individual. These three quantities form a compact quantitative system that describes the heart's performance.
Calculating Cardiac Output
The calculation is straightforward once the two inputs are known, and it is worth performing explicitly with the standard values. A stroke volume of seventy millilitres multiplied by a heart rate of seventy-two beats per minute yields approximately five thousand and forty millilitres per minute, which rounds to the stated average of five litres. The small discrepancy between the exact product and the rounded average is a useful reminder that physiological figures are approximations rather than fixed constants. The formula itself, however, is exact in its logic.
Here ##CO## is cardiac output, ##SV## is stroke volume and ##HR## is heart rate. The same relationship can be written in code for anyone who prefers to compute rather than calculate by hand, and the snippet below reproduces the standard values.
stroke_volume_ml = 70      # millilitres per beat
heart_rate_bpm = 72        # beats per minute

cardiac_output_ml = stroke_volume_ml * heart_rate_bpm
cardiac_output_l = cardiac_output_ml / 1000

print(f"Cardiac output: {cardiac_output_ml} mL/min")
print(f"Cardiac output: {cardiac_output_l:.2f} L/min")
The Body's Ability to Alter Output
The body has the ability to alter the stroke volume as well as the heart rate, and thereby the cardiac output. Because cardiac output is the product of the two, a change in either factor shifts the total, and the two can move together or independently depending on the demand. For example, the cardiac output of an athlete will be much higher than that of an ordinary man, reflecting both a trained heart's capacity to eject more per beat and the ability to sustain a higher rate during exertion. This adaptability is what allows the circulatory system to match blood supply to the metabolic needs of tissues during rest, exercise and stress.
It is worth distinguishing clearly between the two components. Stroke volume reflects the strength of ventricular contraction and the completeness of filling, while heart rate reflects the tempo set by the nodal system and modulated by regulatory influences. A person at rest may maintain a normal cardiac output with a modest rate and a standard stroke volume, whereas the same person sprinting may double the output through coordinated increases in both. The material's example of the athlete captures this principle without prescribing exact figures, and the underlying arithmetic remains the same regardless of the values chosen.
The Two Heart Sounds: Lub and Dub
During each cardiac cycle, two prominent sounds are produced which can be easily heard through a stethoscope. The first heart sound, written as lub, is associated with the closure of the tricuspid and bicuspid valves at the onset of ventricular systole. The second heart sound, written as dub, is associated with the closure of the semilunar valves at the onset of ventricular diastole. These sounds are of clinical diagnostic significance, because their timing and character reveal whether the valves are closing properly and whether the phases of the cycle are occurring in the correct order. The sounds are mechanical consequences of the pressure changes already described, not separate events.
Matching Sounds to Valve Events
The logic connecting each sound to its valve is worth stating plainly. When ventricular pressure rises above atrial pressure, the tricuspid and bicuspid valves are forced shut, producing the first sound. When ventricular pressure falls below the pressure in the pulmonary artery and aorta, the semilunar valves are forced shut, producing the second sound. Each sound therefore marks a pressure crossover, and the sequence lub then dub maps directly onto the transition into ventricular systole and the transition into ventricular diastole. A student who can predict which valves are closing at any moment can also predict which sound is being produced.
This mapping explains why the sounds are clinically useful. A physician listening through a stethoscope is, in effect, auditing the valve timing without opening the chest. If a valve fails to close cleanly, the sound changes character, and if the timing between the two sounds is disturbed, the underlying phase sequence may be abnormal. The material does not catalogue specific disorders here, but it establishes the principle that these two sounds carry diagnostic information. The lesson on disorders of the circulatory system later in the course builds on this foundation, and the next lesson on the electrocardiogram provides the electrical counterpart to these acoustic events.
Listening as a Diagnostic Act
A stethoscope converts the mechanical events of the cycle into audible information, and the two sounds are the most basic elements of that information. The first sound is longer and lower in pitch in practice, while the second is shorter and sharper, though the material's essential point is their association with specific valve closures rather than their acoustic description. What matters for examination purposes is the pairing: lub with the tricuspid and bicuspid valves, dub with the semilunar valves. This pairing is one of the most frequently tested facts in the chapter, and it follows logically from the pressure sequence rather than requiring separate memorisation.
It is also worth noting what the sounds are not. They are not produced by the opening of valves, by the contraction of muscle, or by the flow of blood through open channels in the ordinary sense. They are produced by valve closure, and each closure is caused by a pressure gradient reversing direction. This is why the sounds occur at the boundaries between phases rather than in their middles. The first sound marks the boundary between atrial systole and ventricular systole, and the second marks the boundary between ventricular systole and ventricular diastole. Recognising these boundaries makes the whole cycle easier to hold in mind.
Pressure Gradients as the Engine of the Cycle
Every valve movement in the cardiac cycle is caused by a pressure gradient, and the entire sequence can be read as a story of rising and falling pressures. During joint diastole, atrial pressure exceeds ventricular pressure, so the tricuspid and bicuspid valves stand open and blood flows passively into the ventricles. When the ventricles contract, ventricular pressure rises above atrial pressure, forcing those valves shut and producing the first sound. As ventricular pressure continues to climb above the pressure in the pulmonary artery and aorta, the semilunar valves are forced open and ejection begins. When the ventricles relax, the gradients reverse again, closing the semilunar valves and eventually reopening the atrioventricular valves.
Reading the Cycle Through Pressure
This pressure-based reading is more than a mnemonic; it is the actual mechanism. The material states explicitly that ventricular systole increases ventricular pressure, causing the closure of the tricuspid and bicuspid valves due to the attempted backflow of blood into the atria. It then states that as ventricular pressure increases further, the semilunar valves are forced open. Later, the fall in ventricular pressure causes the closure of the semilunar valves, and a further decline allows the atrioventricular valves to be pushed open by atrial pressure. Every transition is pressure-driven, and the valves are passive responders rather than active agents.
Understanding this helps explain why the sequence cannot run backwards. The valves allow the flow of blood only in one direction, from the atria to the ventricles and from the ventricles to the pulmonary artery or aorta, and they prevent any backward flow. This one-way arrangement, established in the previous lesson, is what converts pressure oscillations into directed circulation. Without competent valves, the pressure changes would simply slosh blood back and forth, and the cardiac output would collapse. The cycle works because pressure and valve competence are perfectly matched.
Connecting Pressure to Performance
Pressure gradients also connect the mechanical events to the quantitative measures of performance. The pressure the ventricle generates during systole determines how forcefully blood is ejected, and the completeness of filling during diastole determines how much blood is available to eject. Together these set the stroke volume, which multiplied by heart rate gives the cardiac output. The body's ability to alter stroke volume and heart rate is therefore an ability to alter the pressures and timings within the cycle. An athlete's higher cardiac output reflects a heart that fills more completely and ejects more forcefully, cycle after cycle.
This connection is worth carrying into the next lesson. The electrocardiogram records the electrical activity that initiates each cycle, but the mechanical consequences, the pressure changes and valve movements, are what the electrical signal ultimately produces. Reading an ECG therefore requires knowing what mechanical event each electrical wave precedes. The P wave relates to atrial depolarisation and the ensuing atrial systole, the QRS complex to ventricular depolarisation and the ensuing ventricular systole, and the T wave to ventricular repolarisation and the return to diastole. The cycle described here is the mechanical counterpart of that electrical script.
Going Further: Context That Deepens the Lesson
The material states that atrial contraction increases the flow of blood into the ventricles by about thirty per cent, and this figure deserves a moment of emphasis because it corrects a common misconception. Many students assume that the atria do most of the work of filling the ventricles, but in fact passive filling during joint diastole accounts for the majority. Atrial systole contributes the final thirty per cent, acting as a topping-up mechanism rather than the primary pump. This is why a heart can continue to function reasonably well even when atrial contraction is impaired, though the loss of that thirty per cent reduces the reserve available during exertion.
Why the Thirty Per Cent Figure Matters
Understanding the thirty per cent contribution clarifies the division of labour between the chambers. The atria are priming chambers, and the ventricles are the main pumps, which is consistent with the observation that the walls of ventricles are much thicker than those of the atria. The thicker ventricular muscle generates the higher pressures needed for ejection into the pulmonary artery and aorta, while the thinner atrial muscle needs only to complete filling. The figure also explains why the conduction delay at the atrioventricular node is physiologically valuable: it allows the atria to finish that final thirty per cent before the ventricles begin to contract and close their valves.
Cardiac Output as a Product
The second idea worth reinforcing is that cardiac output equals stroke volume multiplied by heart rate. This relationship is simple but powerful, because it shows that the same output can be achieved in different ways. A trained athlete may achieve a high output through a large stroke volume at a relatively low resting rate, while an untrained person may rely more heavily on rate. During exercise, both factors typically rise together. The formula also explains why a fall in either component must be compensated by a rise in the other if output is to be maintained, a principle that underlies much of cardiovascular regulation.
These two background points do not alter the material's content; they simply make it easier to reason with. The thirty per cent figure and the cardiac output formula are both stated in the source, and the discussion above only draws out their implications. Keeping the material's terminology and numbers intact while exploring their consequences is the right way to study this chapter, because examinations reward precise recall of the stated values and clear reasoning about what they mean. The next lesson turns to the electrocardiogram, where the electrical activity underlying these mechanical events is recorded and interpreted.
Consolidating the Cycle: A Worked Narrative
Pulling the lesson together, a complete cardiac cycle can be narrated as a single continuous story. It begins in joint diastole, with all four chambers relaxed, the tricuspid and bicuspid valves open, the semilunar valves closed, and blood flowing from the pulmonary veins and vena cava into the ventricles through the atria. The sino-atrial node fires, both atria contract in atrial systole, and ventricular filling increases by about thirty per cent. The impulse travels through the atrioventricular node and bundle of His to the ventricular musculature, the ventricles contract in ventricular systole, the atrioventricular valves close with the first sound, and the semilunar valves open to allow ejection into the pulmonary artery and aorta.
From One Beat to a Lifetime of Beats
The ventricles then relax in ventricular diastole, the semilunar valves close with the second sound, and as ventricular pressure falls further the atrioventricular valves reopen under atrial pressure. The heart returns to joint diastole, the sino-atrial node fires again, and the sequence repeats. Each repetition ejects approximately seventy millilitres from each ventricle, and at seventy-two beats per minute this yields a cardiac output of about five litres per minute. The body can alter both stroke volume and heart rate, so the output is not fixed but responsive, which is why an athlete's output can be much higher than an ordinary man's.
Preparing for the Electrocardiogram
With the mechanical cycle firmly in mind, the electrical record becomes far easier to interpret. The electrocardiogram is a graphical representation of the electrical activity of the heart during a cardiac cycle, and every deflection on that trace corresponds to an event in the sequence just narrated. The next lesson examines the standard ECG in detail, but the groundwork is now complete: you know the order of the phases, the valve events that define them, the sounds that mark their boundaries, and the arithmetic that converts a single beat into a minute's worth of circulation. That combination is the core of this lesson and the foundation for the lessons that follow.
Also Read
- No links available.
From our network :
- Mastering DB2 12.1 Instance Design: A Technical Deep Dive into Modern Database ArchitectureComprehensive guide to DB2 12.1 Instance Design. Explore architectural components, HADR setup, buffer pool tuning, and security policies for IBM DB2 12.1. Includes 10 functional SQL and Shell samples.
- AI-Powered 'Precision Diagnostic' Replaces Standard GRE Score ReportsDiscover the new GRE Precision Diagnostic. Learn how AI-powered behavioral analytics and time-to-solve tracking are replacing standard GRE score reports to empower students.
- Trump Political Strategy How Geopolitical Stunts Serve As Media Diversions
- Analyzing Trump Deportation Numbers Insights Into The 2026 Immigration Crackdown
- Vite 6/7 'Cold Start' Regression in Massive Module GraphsIn-depth analysis of Vite 6/7 cold start regressions in massive module graphs. Learn about barrel file issues, pre-bundling optimizations, and how to improve Vite dev server performance.
- EV 2.0: The Solid-State Battery Breakthrough and Global Factory ExpansionDiscover the impact of the Solid-State Battery Breakthrough on the EV market. Learn about CATL and BYD stock growth, global factory expansion in Europe, and the future of EV 2.0 technology.
- 10 Physics Numerical Problems with Solutions for IIT JEEPrepare for IIT JEE with 10 physics numerical problems, complete with detailed solutions and conceptual explanations. Ideal for mastering kinematics, thermodynamics, electromagnetism, and optics.
- Mastering DB2 LUW v12 Tables: A Comprehensive Technical GuideComprehensive guide on DB2 LUW v12 tables. Explore CREATE TABLE syntax, BLU Acceleration, range partitioning, data types, and security features for IBM DB2 LUW v12.
- 98% of Global MBA Programs Now Prefer GRE Over GMAT Focus EditionExplore why 98% of global MBA programs now prefer the GRE over GMAT Focus. Learn about the shorter GRE format, verbal logic importance, and strategic versatility for students.
RESOURCES
- Cardiac Cycle, Heart Sounds, and Cardiac Output - YouTubeyoutube.comJan 5, 2016 ... Comments · Cardiovascular System- Blood · Path of Blood Flow through the Heart | Step by step through every chamber,…
- Physiology, Heart Sounds - StatPearls - NCBI Bookshelfncbi.nlm.nih.govJul 17, 2023 ... Heart sounds are created from blood flowing through the heart chambers as the cardiac valves open and close during the…
- Physiology, Cardiac Cycle - StatPearls - NCBI Bookshelfncbi.nlm.nih.govThis gradient closes the mitral valve, which marks the beginning of systole and causes the first heart sound (in concert with the tricuspid valve),…
- Cadiac cycle and heart sound | PPTX - Slideshareslideshare.netNov 27, 2021 ... The cardiac cycle includes coordinated events during each heartbeat, comprising systole (heart contraction) and diastole (heart relaxation) ...
- Cardiac Cycle - CV Physiologycvphysiology.com... heart sounds during a single cycle of cardiac contraction and relaxation. These changes are related in time to the electrocardiogram. An online video…
- The Heart: Cardiac Cycle, Cardiac Output, and Regulation | Notespearson.comSecond Heart Sound (S2, "dup"): Associated with closure of semilunar valves at the beginning of ventricular diastole. Heart Murmurs: Abnormal heart sounds, ...
- Duration of cardiac systole in children with femoral arteriovenous ...pmc.ncbi.nlm.nih.gov6) the decrease at a cycle length of 0.50 second was greater than 0.05 second in tilting from horizontal to 80 degrees. The splitting…
- The Cardiac Cycle | Wigger's diagram - Geeky Medicsgeekymedics.comMay 7, 2022 ... Ventricular pressure falls lower than arterial pressure, at which point the aortic valve will close. This produces the second heart…
- The Cardiac Cycle | Measuring and Managing the Output of the Heartuen.pressbooks.pubFeb 25, 2026 ... The closing of the semilunar valves, and the opening of the AV valves, is heard as a “dub” sound. “Lub”…
- The Cardiac Cycle - Pressures in The Heart - TeachMePhysiologyteachmephysiology.comAug 13, 2026 ... When listening to the heart, what can be heard are two sounds, sometimes described as a “lub” and a “dub”.…
- Cardiac tamponade: a clinical challengeescardio.orgSep 27, 2017 ... ... heart sounds. Other clinical signs in a patient with cardiac ... Because the heart is compressed throughout the cardiac…
- Cardiac Cycle - an overview | ScienceDirect Topicssciencedirect.comAs a result, cardiac output can be persevered in settings of diminished or absent atrial contraction, as seen in atrial fibrillation or even complete…
- Cardiac Cycle and Output Topics - Ninja Nerdninjanerd.orgTrack pressure volume changes to explain heart sounds, preload, afterload, and cardiac output.
- Heart sounds - Wikipediaen.wikipedia.orgThe S1 heart sound is intensified due to the increased cardiac output. ... cardiac cycle, depending on the cause of the murmur. Contents. 1…
- Hemodynamics - LearnPICUlearnpicu.com... cardiac output, etc. Changes in inotropy shift the ESPVR curve left with increases ... Figure 7: Pressure, Volume EKG, Heart Sounds over the…