Every chemical transformation that sustains a living cell must clear an energy hurdle before it can proceed, and enzymes are the molecules that lower that hurdle without altering the destination. This lesson examines the nature of enzyme action as a repeating catalytic cycle of four defined steps, and then turns to the conditions that govern how fast that cycle runs: temperature, pH, substrate concentration and the presence of inhibitors. The treatment follows the sequence of ideas in the chapter, beginning with the energy profile of a reaction and the concept of activation energy, then moving through the enzyme-substrate complex, the four-step cycle, and the factors that modify enzyme activity.
The central argument is that catalysis is not a mysterious force but a structural and energetic event. A substrate binds at a specific site, the enzyme adjusts its shape around it, bonds are broken and products released, and the free enzyme is ready to repeat the process. Around this core, the chapter builds a quantitative picture: activity rises and falls with temperature and pH around an optimum, velocity saturates at a maximum value ##V_{max}## as substrate concentration increases, and specific chemicals can shut activity down. The malonate example shows how a molecule resembling the substrate can occupy the binding site and block the reaction.
For learners moving from metabolic pathways into enzyme kinetics, this lesson supplies the vocabulary and the graphical reasoning that later classification and co-factor study will assume. The aim is to read the energy diagram, the activity curves and the saturation curve as statements about molecular events, and to connect each factor to the tertiary structure of the protein. By the end, the four-step cycle, the definitions of optimum temperature and optimum pH, the meaning of ##V_{max}## and the logic of competitive inhibition should be firmly in place.
On This Page
- The Energy Barrier and the Meaning of Activation Energy
- The Enzyme-Substrate Complex and the Four-Step Catalytic Cycle
- Temperature and pH: Optimum Values and Denaturation
- Substrate Concentration, Velocity and the Meaning of Vmax
- Inhibition and the Malonate Example
- Bringing the Factors Together and Preparing for Classification
The Energy Barrier and the Meaning of Activation Energy
Before the catalytic cycle can be understood, the reaction itself must be placed on an energy landscape. The chapter describes a progression from a stable substrate to a stable product through a transition state structure, noting that many more altered structural states may lie between the two stable ends. The essential point is that all intermediate structural states are unstable, and stability here is a statement about the energy status of the molecule or structure. When this progression is plotted, the vertical axis carries potential energy content and the horizontal axis carries the progression of structural transformation through the transition state.
Two features of that graph carry the argument. The first is the energy level difference between substrate and product: if the product sits at a lower level than the substrate, the reaction is exothermic and no energy need be supplied by heating to form the product. The second feature is more important for catalysis. Whether the reaction is exothermic and spontaneous or endothermic and energy requiring, the substrate must pass through a much higher energy state, the transition state. The difference in average energy content between the substrate and this transition state is called the activation energy.
Why the Barrier Must Be Crossed
The activation energy is the toll that every reacting molecule must pay, and it is paid regardless of whether the overall reaction releases energy. A spontaneous reaction is therefore not a barrier-free reaction; it is one whose products lie lower than its substrates, so that the net change favours product formation once the barrier has been crossed. This distinction matters because it separates thermodynamics from rate. The height of the barrier governs how quickly the reaction proceeds, while the difference between substrate and product levels governs the direction and energy yield of the overall change.
Enzymes act on the first of these quantities. The chapter states plainly that enzymes eventually bring down this energy barrier, making the transition of substrate to product more easy. The barrier is lowered, not removed, and the enzyme does not change the energy levels of substrate and product themselves. This is why an enzyme accelerates a reaction without altering its equilibrium position, and why the same enzyme can catalyse a reaction in either direction depending on the concentrations present.
Reading the Energy Diagram
A reaction coordinate diagram for an enzyme-catalysed reaction shows two barrier heights: the activation energy without enzyme and the activation energy with enzyme. The catalysed path is lower, and the difference between the two peaks is the measure of catalytic power. The diagram also shows the transition state at the summit, a fleeting arrangement in which bonds are partly broken and partly formed. Because the transition state is unstable, it cannot be isolated, but its energy level determines the rate at which substrate molecules cross over into product.
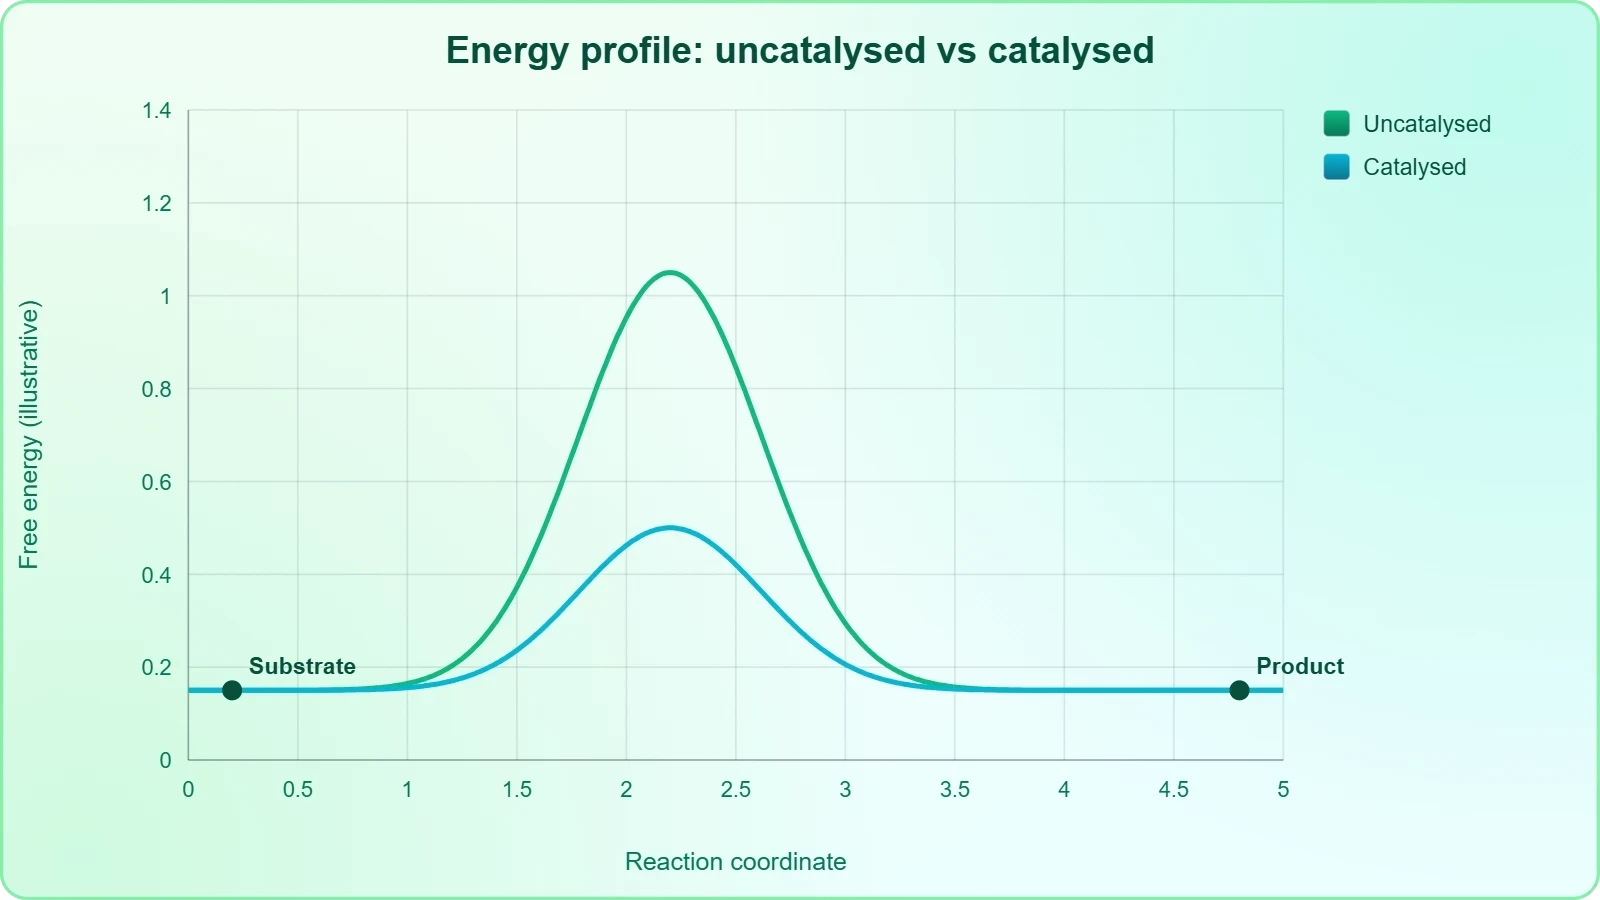
This graphical habit of thought prepares the ground for the kinetic curves that follow. The same logic of energy and stability explains why temperature and pH matter: both act on the tertiary structure of the protein, and a distorted active site raises the barrier again. The diagram is therefore not a decorative figure but the conceptual anchor for the whole lesson, linking molecular structure to measurable velocity.
The Enzyme-Substrate Complex and the Four-Step Catalytic Cycle
Each enzyme has a substrate binding site in its molecule, so that a highly reactive enzyme-substrate complex is produced when the two meet. This complex is short-lived and dissociates into its products and the unchanged enzyme, with an intermediate formation of the enzyme-product complex. The chapter writes the sequence as enzyme plus substrate forming the enzyme-substrate complex, which proceeds to the enzyme-product complex, which then releases enzyme plus product. The formation of the enzyme-substrate complex is essential for catalysis; without it, no reaction is promoted.
The catalytic cycle of enzyme action is then described in four steps. First, the substrate binds to the active site of the enzyme, fitting into the active site. Second, the binding of the substrate induces the enzyme to alter its shape, fitting more tightly around the substrate. Third, the active site, now in close proximity to the substrate, breaks the chemical bonds of the substrate and the new enzyme-product complex is formed. Fourth, the enzyme releases the products of the reaction and the free enzyme is ready to bind another molecule of substrate and run through the cycle once again.
Binding, Shape Change and Bond Breaking
The second step deserves particular attention because it captures the dynamic character of the active site. The enzyme is not a rigid lock into which a rigid key slides; the binding of the substrate induces the enzyme to alter its shape and fit more tightly around the substrate. This tightening brings catalytic groups into close proximity with the bonds that must be broken, which is precisely what the third step describes. The proximity of the active site to the substrate is the physical basis for the bond-breaking event that produces the enzyme-product complex.
The cycle is therefore a sequence of recognition, adjustment, chemistry and release. Recognition is the fitting of substrate into the active site; adjustment is the induced shape change; chemistry is the breaking of substrate bonds and formation of the enzyme-product complex; release is the departure of products and restoration of the free enzyme. Each stage depends on the tertiary structure of the protein, which explains why conditions that distort that structure also abolish activity.
The Cycle as a Repeating Process
The fourth step closes the loop rather than ending the story. The enzyme emerges unchanged and is ready to bind another molecule of substrate, so a single enzyme molecule can process many substrate molecules in succession. This is the molecular explanation for the high rates discussed in the preceding lesson on metabolic pathways: the enzyme is a catalyst that is recovered after each round, not a reactant consumed in the reaction. The short-lived nature of the complexes keeps the cycle turning quickly.
Written as a scheme, the cycle reads as a chain of reversible and irreversible events rather than a single arrow. The enzyme-substrate complex forms, passes through the enzyme-product complex, and dissociates to free enzyme and product. Keeping this sequence in mind makes the later discussion of inhibitors easier, because an inhibitor is simply a chemical that interferes with one of these steps, most often the very first binding event at the substrate-binding site.
Temperature and pH: Optimum Values and Denaturation
The activity of an enzyme can be affected by a change in conditions that alters the tertiary structure of the protein. These conditions include temperature, pH, change in substrate concentration, and the binding of specific chemicals that regulate activity. Enzymes generally function in a narrow range of temperature and pH. Each enzyme shows its highest activity at a particular temperature and pH called the optimum temperature and optimum pH, and activity declines both below and above the optimum value. The curves are therefore peaked rather than flat, rising to a maximum and falling away on either side.
The two sides of the temperature curve have different causes. Low temperature preserves the enzyme in a temporarily inactive state, so cooling slows activity without destroying the molecule; warming restores it. High temperature destroys enzymatic activity because proteins are denatured by heat. The distinction is important in practice: refrigeration preserves enzymes, whereas boiling inactivates them permanently. The pH curve follows the same peaked pattern, with activity falling away on either side of the optimum as the ionic environment disturbs the structure of the protein.
Why the Optimum Exists
An optimum is the signature of a structure that must remain intact to work. The active site is a three-dimensional arrangement held in place by the folding of the polypeptide chain, and both heat and extremes of pH disturb that folding. Near the optimum, the site retains the shape that binds substrate and brings catalytic groups into position. Away from it, the shape is progressively lost, the substrate no longer fits, and the rate of product formation falls. The optimum is thus a property of the protein's tertiary structure, not a separate instruction.
This reasoning also explains why different enzymes have different optima. The chapter does not assign a universal value, and none should be assumed. Each enzyme has its own particular temperature and pH at which activity peaks, reflecting the environment in which it normally operates. The peaked curve is the general form; the position of the peak is specific to the enzyme. Learners should read the graph as a statement about structural integrity rather than as a fixed constant to memorise.
Interpreting the Activity Curves
When the temperature and pH curves are plotted together with the substrate concentration curve, three distinct shapes appear. The temperature and pH curves are bell-shaped, rising to an optimum and falling away. The substrate curve rises at first and then levels off at a plateau. Recognising which shape belongs to which variable prevents a common confusion: temperature and pH change the enzyme itself, whereas substrate concentration changes the availability of the molecule the enzyme acts upon. The first two can destroy activity; the third merely limits it.
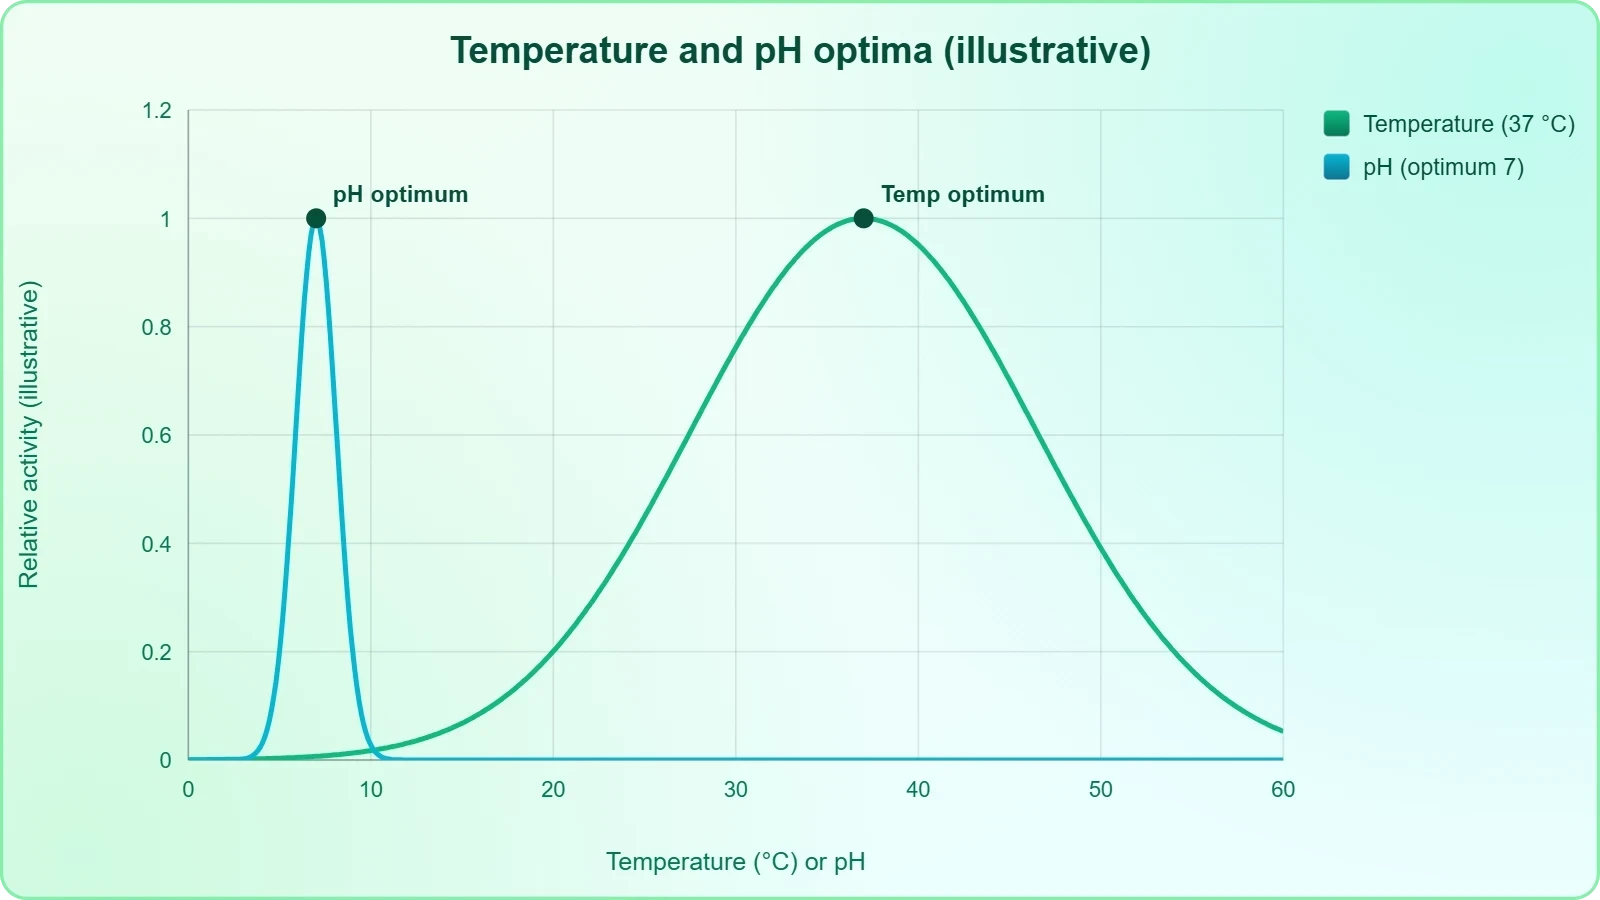
A practical reading of the curves follows from this. If activity is low, the cause may be an unfavourable temperature, an unfavourable pH, or a shortage of substrate, and the three possibilities are distinguished by the shape of the response. Raising temperature from a low value increases activity until the optimum, then destroys it. Adjusting pH towards the optimum restores activity. Adding substrate increases velocity only until the enzyme is saturated, after which further addition has no effect.
Substrate Concentration, Velocity and the Meaning of Vmax
With an increase in substrate concentration, the velocity of the enzymatic reaction rises at first. The reaction ultimately reaches a maximum velocity, ##V_{max}##, which is not exceeded by any further rise in the concentration of the substrate. The reason given is a simple counting argument: the enzyme molecules are fewer than the substrate molecules, and after saturation of these molecules there are no free enzyme molecules to bind with the additional substrate molecules. The curve therefore rises and then flattens into a plateau, and the plateau height is ##V_{max}##.
The saturation curve is a direct consequence of the catalytic cycle described earlier. Every round of catalysis requires a free enzyme molecule to bind a substrate molecule, and the number of enzyme molecules is finite. When substrate is plentiful, every enzyme molecule is occupied and the cycle runs as fast as the available enzyme allows. Adding more substrate cannot increase the rate because there is nothing free to bind it. The velocity at saturation is thus a measure of how much enzyme is present and how quickly each molecule turns over.
Why the Curve Plateaus
The plateau is not a failure of the enzyme but a statement about capacity. At low substrate concentration, many enzyme molecules are idle and the rate rises steeply as substrate is added. As concentration increases, more and more enzyme molecules become occupied, and the rise slows. At saturation, all binding sites are engaged and the rate is limited by the catalytic step itself. The chapter's explanation is explicit: the enzyme molecules are fewer than the substrate molecules, and after saturation there are no free enzyme molecules to bind additional substrate.
This reasoning also clarifies what ##V_{max## is not. It is not the fastest possible reaction in absolute terms, nor a fixed property of the substrate alone. It depends on the amount of enzyme present and on the conditions of temperature and pH, since these determine how well each enzyme molecule functions. The plateau is therefore a conditional ceiling, reached under the particular conditions of the experiment, and it shifts if those conditions change.
Reading the Saturation Curve
The graph of velocity against substrate concentration carries a marked point at half of the maximum velocity, labelled ##K_m## in the figure. The curve rises steeply at low substrate concentration and bends towards the plateau as concentration increases. The shape is characteristic of a binding process in which a limited number of sites are progressively filled. Recognising this shape allows a learner to distinguish saturation from inhibition: saturation flattens the curve at a high value, whereas an inhibitor lowers the achievable velocity or shifts the curve to the right.
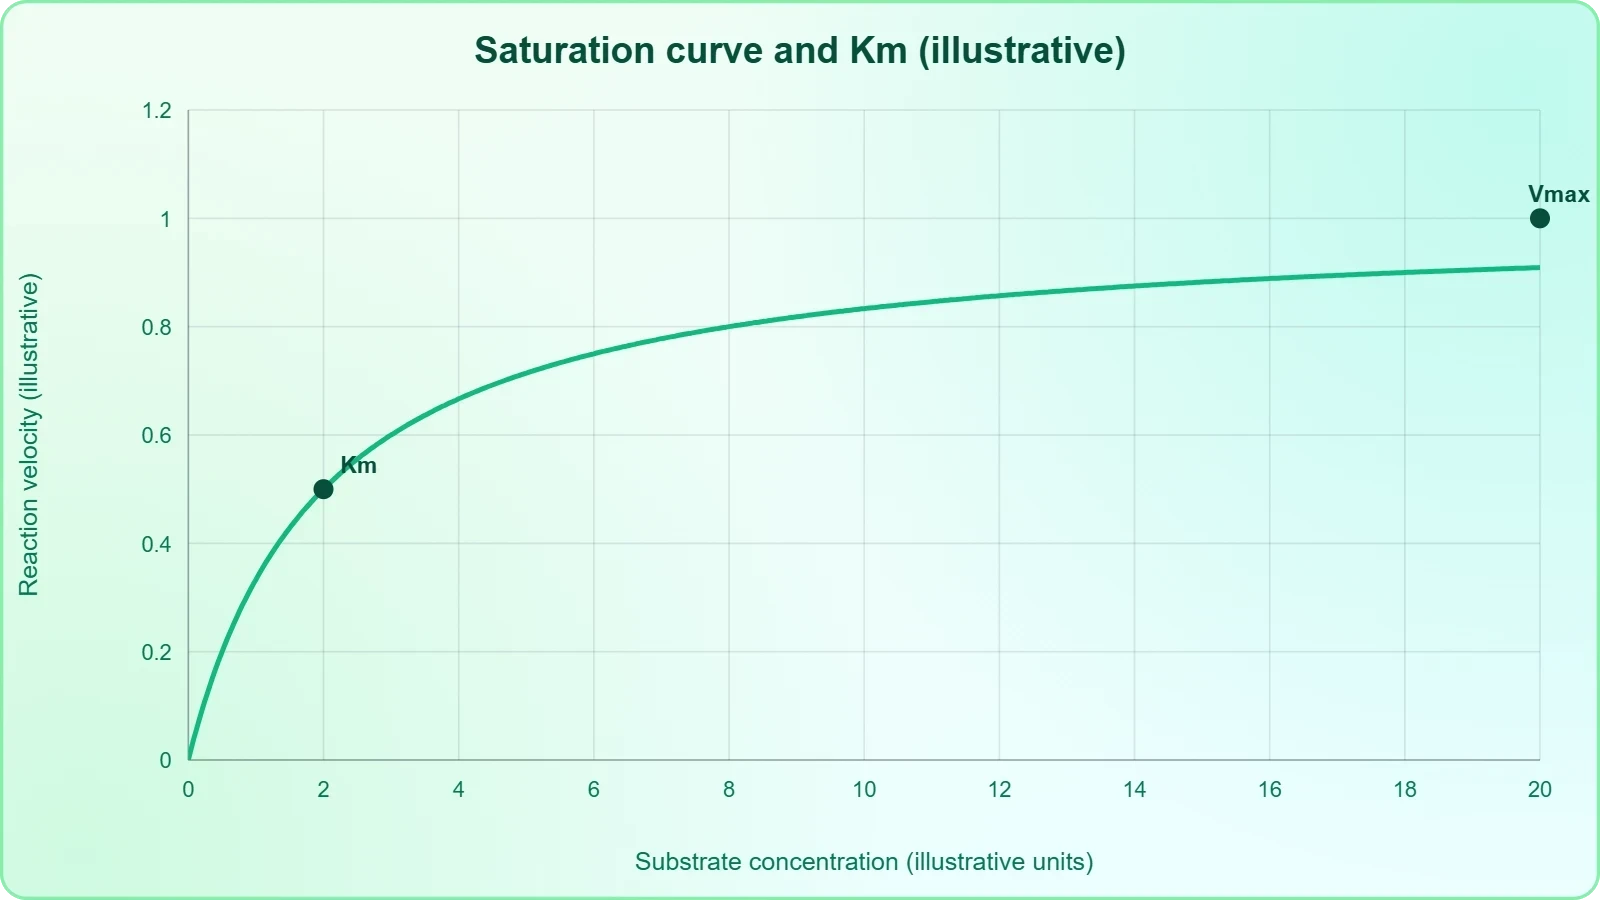
In practical terms, the saturation curve tells an experimenter when adding more substrate is pointless. Beyond the point where the plateau is reached, further substrate produces no increase in velocity, and effort is better spent on other variables. The curve also explains why enzyme assays are designed with substrate in excess: under saturating conditions, the measured velocity reflects the amount of active enzyme rather than the availability of substrate.
Inhibition and the Malonate Example
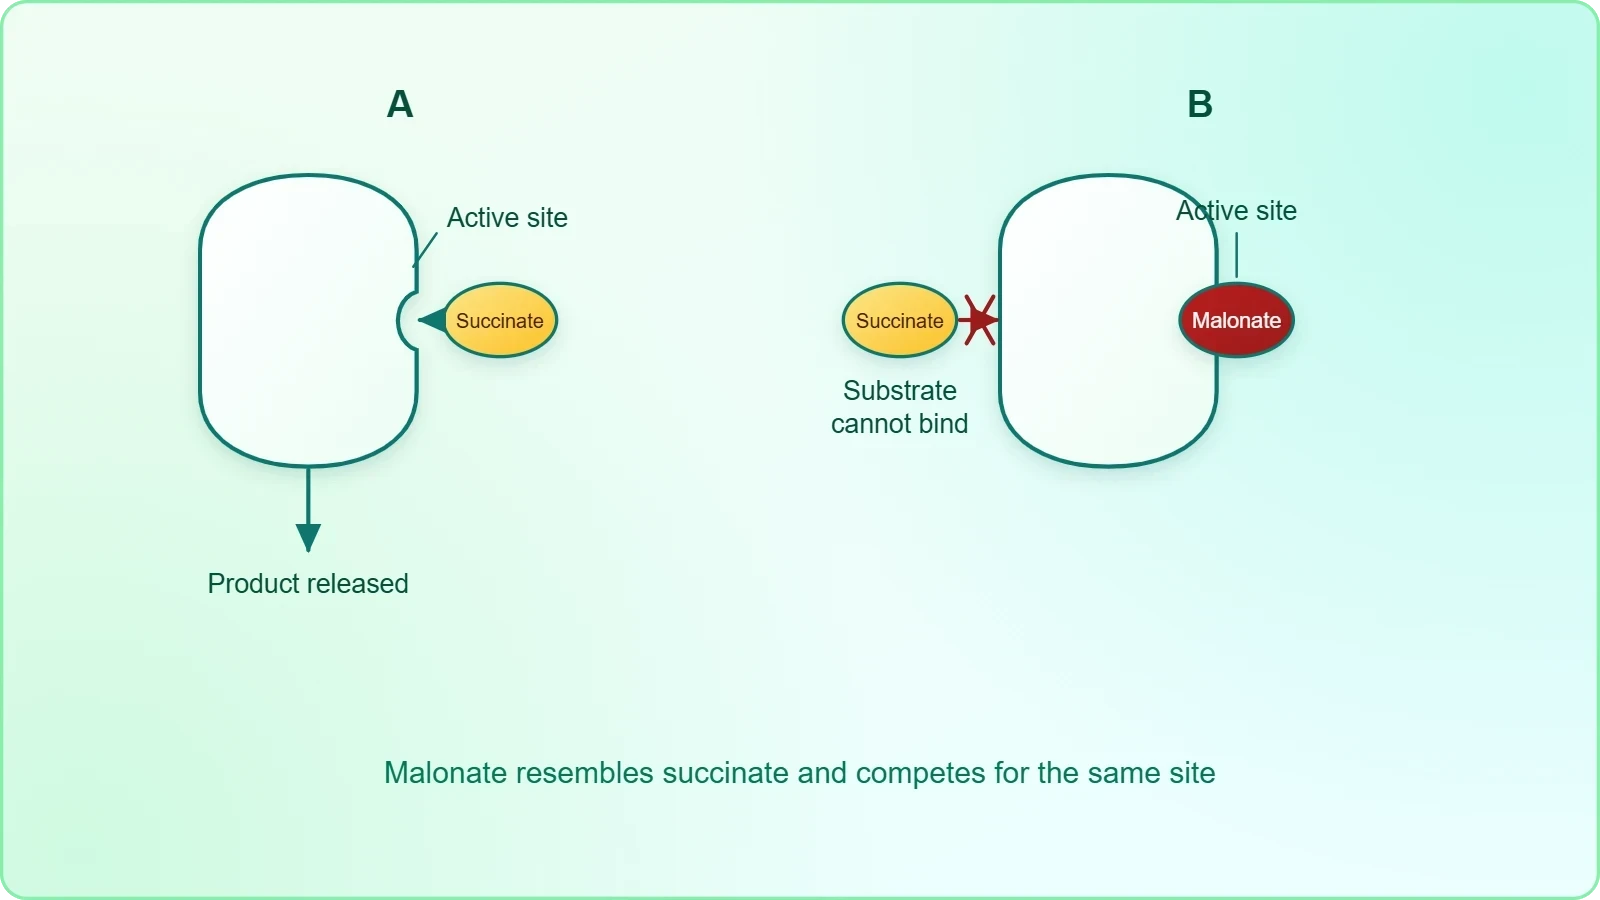
The activity of an enzyme is also sensitive to the presence of specific chemicals that bind to the enzyme. When the binding of the chemical shuts off enzyme activity, the process is called inhibition and the chemical is called an inhibitor. The chapter then singles out one important class. When the inhibitor closely resembles the substrate in its molecular structure and inhibits the activity of the enzyme, it is known as a competitive inhibitor. Because of its close structural similarity with the substrate, the inhibitor competes with the substrate for the substrate-binding site of the enzyme.
The consequence follows directly from the competition. The substrate cannot bind, and as a result the enzyme action declines. The chapter gives a specific example: the inhibition of succinic dehydrogenase by malonate, which closely resembles the substrate succinate in structure. The resemblance is the mechanism; because malonate can occupy the site that succinate would use, the enzyme is diverted from its normal substrate. Such competitive inhibitors are often used in the control of bacterial pathogens, a practical application that follows from the same structural logic.
Competition at the Substrate-Binding Site
The word competitive is precise. The inhibitor does not destroy the enzyme or alter its catalytic machinery; it occupies the substrate-binding site and thereby excludes the substrate. The outcome depends on the relative concentrations and on how closely the inhibitor resembles the substrate, since the resemblance is what allows it to fit the site at all. This is why the malonate example is instructive: malonate and succinate are structurally similar, so malonate can compete for the same site on succinic dehydrogenase and the enzyme's action declines.
This mechanism also explains why competitive inhibition is reversible in principle. If the inhibitor is bound reversibly, increasing the concentration of substrate can outcompete it and restore activity. The competition is a contest for occupancy of the same site, and the side that occupies more of the sites wins. The chapter's account stops at the decline in enzyme action, but the logic of competition at a shared site carries the further implication that the balance can be shifted.
From Molecular Resemblance to Practical Use
The statement that competitive inhibitors are often used in the control of bacterial pathogens connects the molecular detail to application. A chemical that resembles a bacterial enzyme's substrate can occupy that enzyme's binding site and shut down the reaction the pathogen depends on. The selectivity comes from the shape of the site: the inhibitor must resemble the substrate closely enough to fit. This is the same principle that makes the malonate example work, applied to a practical problem rather than a laboratory demonstration.
For the learner, the example fixes the definition. A competitive inhibitor resembles the substrate, competes for the substrate-binding site, prevents the substrate from binding, and causes enzyme action to decline. The malonate and succinate pair is the reference case to remember, and the use of such inhibitors against bacterial pathogens is the application to remember alongside it. Both follow from a single idea: molecular resemblance allows occupancy of a specific site.
Bringing the Factors Together and Preparing for Classification
The factors discussed in this lesson converge on a single theme: enzyme activity depends on the integrity of the protein and on the availability of its partners. Temperature and pH act on the tertiary structure, so they can preserve, optimise or destroy activity. Substrate concentration acts on occupancy of the binding sites, so it can raise velocity up to a ceiling without altering the enzyme. Inhibitors act by binding to the enzyme, and competitive inhibitors do so by resembling the substrate closely enough to occupy its site. Each factor can be traced back to the four-step cycle.
Reading the factors together also prevents a common error. Temperature and pH are not interchangeable with substrate concentration: the first two change the enzyme, while the third changes the supply of the molecule the enzyme acts upon. A rise in temperature beyond the optimum destroys activity permanently, whereas a shortage of substrate merely limits the rate until more is supplied. Similarly, an inhibitor reduces activity by occupying the enzyme, which is a different event from saturation, where the enzyme is fully occupied by its proper substrate.
A Unified View of the Catalytic Cycle
Every factor in this lesson can be located at a step of the cycle. Temperature and pH determine whether the active site retains the shape needed for step one, the binding of substrate. Substrate concentration determines how often a free enzyme encounters a substrate molecule and therefore how close the cycle comes to its maximum rate. Inhibitors interfere with step one by occupying the binding site, which is why competitive inhibition is described in terms of competition rather than destruction. The cycle is the common thread.
This unified view is also a study strategy. Rather than memorising four separate curves, a learner can ask of any condition: does it change the enzyme's structure, the availability of substrate, or the occupancy of the binding site? The answer identifies the curve and the mechanism. The energy diagram supplies the reason catalysis matters at all, the cycle supplies the sequence of events, and the factors supply the conditions under which the sequence runs quickly or slowly.
Looking Ahead to Classification and Co-factors
The next lesson turns to the classification and nomenclature of enzymes and to co-factors. The present lesson has prepared the ground by establishing what an enzyme does and how its activity is measured. Classification groups enzymes by the type of reaction they catalyse, which presupposes an understanding of the catalytic cycle and of the substrate specificity that the binding site provides. Co-factors are non-protein constituents bound to the enzyme to make it catalytically active, a point that extends the structural account given here.
The malonate example and the saturation curve will remain useful reference points. The first illustrates how a specific site can be occupied by a look-alike molecule, a principle that recurs whenever enzyme control is discussed. The second illustrates how a finite number of enzyme molecules sets a ceiling on rate, a principle that recurs whenever enzyme amounts are compared. With the cycle, the energy barrier and the four factors in place, the learner is ready to see how thousands of enzymes are sorted into six classes and supplied with the co-factors they need.
Going further
Enzymes in the human body usually work best around body temperature and near-neutral pH, which is consistent with the general rule that each enzyme has an optimum suited to its environment. Competitive inhibitors are used in medicine, for example to block enzymes in bacteria, extending the chapter's point that such inhibitors are often used in the control of bacterial pathogens. These observations sit alongside the material rather than replacing it, and they illustrate how the principles of the catalytic cycle and the four factors carry into physiology and pharmacology.
Also Read
- No links available.
From our network :
- 98% of Global MBA Programs Now Prefer GRE Over GMAT Focus EditionExplore why 98% of global MBA programs now prefer the GRE over GMAT Focus. Learn about the shorter GRE format, verbal logic importance, and strategic versatility for students.
- Mastering DB2 LUW v12 Tables: A Comprehensive Technical GuideComprehensive guide on DB2 LUW v12 tables. Explore CREATE TABLE syntax, BLU Acceleration, range partitioning, data types, and security features for IBM DB2 LUW v12.
- Analyzing Trump Deportation Numbers Insights Into The 2026 Immigration Crackdown
- 10 Physics Numerical Problems with Solutions for IIT JEEPrepare for IIT JEE with 10 physics numerical problems, complete with detailed solutions and conceptual explanations. Ideal for mastering kinematics, thermodynamics, electromagnetism, and optics.
- Mastering DB2 12.1 Instance Design: A Technical Deep Dive into Modern Database ArchitectureComprehensive guide to DB2 12.1 Instance Design. Explore architectural components, HADR setup, buffer pool tuning, and security policies for IBM DB2 12.1. Includes 10 functional SQL and Shell samples.
- EV 2.0: The Solid-State Battery Breakthrough and Global Factory ExpansionDiscover the impact of the Solid-State Battery Breakthrough on the EV market. Learn about CATL and BYD stock growth, global factory expansion in Europe, and the future of EV 2.0 technology.
- AI-Powered 'Precision Diagnostic' Replaces Standard GRE Score ReportsDiscover the new GRE Precision Diagnostic. Learn how AI-powered behavioral analytics and time-to-solve tracking are replacing standard GRE score reports to empower students.
- Vite 6/7 'Cold Start' Regression in Massive Module GraphsIn-depth analysis of Vite 6/7 cold start regressions in massive module graphs. Learn about barrel file issues, pre-bundling optimizations, and how to improve Vite dev server performance.
- Trump Political Strategy How Geopolitical Stunts Serve As Media Diversions
RESOURCES
- Enzymes: principles and biotechnological applications - PMC - NIHpmc.ncbi.nlm.nih.govVarious environmental factors are able to affect the rate of enzyme ... In effect this inner reserve of enzyme will offset the loss of…
- Enzymes – Structure, Classification, and Function - BYJU'Sbyjus.comThe nature of enzyme action and factors affecting the enzyme activity are discussed below. Factors Affecting Enzyme Activity. The conditions of the reaction ...
- Enzyme | Definition, Mechanisms, & Nomenclature - Britannicabritannica.com2 days ago ... Enzyme · Introduction & Top Questions · Chemical nature · Nomenclature · Mechanism of enzyme action · Factors affecting enzyme…
- Soil nitrogen-hydrolyzing enzyme activities respond differently to the ...nature.comMay 30, 2025 ... ... factors affecting enzyme activities in FT events. Soil N-hydrolyzing enzyme activity was mainly regulated by environmental factors, which ...
- Characteristics of soil C:N:P stoichiometry and enzyme activities in ...journals.plos.orgJul 14, 2022 ... Nitrogen was the main factor limiting the grasslands productivity, and pH, TN, SOC, Richness index and Simpson diversity index were…
- Variation in soil enzyme activity with amendments of biochar and ...nature.comFeb 7, 2025 ... ... factors affecting enzyme activity. CGS incorporating 2% BC and 0.05 ... The addition of BC significantly affected the activities…
- Early-life regional and temporal variation in filaggrin-derived natural ...pubmed.ncbi.nlm.nih.gov... enzyme activity, corneocyte phenotypes and plasmin activity: implications for atopic dermatitis ... natural moisturizing factors (NMFs)], activities of ...
- Effects of Close-to-Nature Transformation on Soil Enzyme Activities ...mdpi.comJun 2, 2022 ... In addition, soil enzyme activity greatly affected the ... factors affecting organic carbon components. The results showed that ...
- Responses of Soil Microbial Biomass and Enzyme Activities to ...frontiersin.orgResponses of Soil Microbial Biomass and Enzyme Activities to Natural ... Soil C:N ratio, TN, and MC were the most important factors affecting soil…
- Genetic Basis of the Antioxidant and Serum Enzyme Activities of the ...mdpi.comOct 20, 2025 ... Investigating the activity of serum biochemical factors, together with antioxidant enzymes, in fish is important for the assessment of their ...
- Nanozymes as Next-Generation Therapeutics: Synergizing Enzyme ...link.springer.comJun 11, 2025 ... ... enzyme-like catalytic activities, effectively mimicking the function of natural enzymes. ... Factors Influencing Nanozyme Activity.
- enzyme,nature and classification,mechan ism of enzyme actiondhingcollegeonline.co.inThe nature of enzyme action and factors affecting the enzyme activity are discussed below. ... The type of substrate is another factor that affects…
- Several lines of antioxidant defense against oxidative stresslink.springer.comMar 14, 2024 ... The most important factors affecting the enzyme-mimicking activity of nanozymes are the nature ... activity at the site of action…
- biomolecules chapter 9 - NCERTncert.nic.in9.8.3 Nature of Enzyme Action. Each enzyme (E) has a substrate (S) binding ... 9.8.4 Factors Affecting Enzyme Activity. The activity of an enzyme…