Every claim about the chemistry of life rests on a measurement, and the most fundamental of those measurements begins with a living tissue placed on a balance. Before a learner can discuss proteins, polysaccharides or nucleic acids, they must first understand how biologists separate the water in a sample from the matter that remains, and how they distinguish the organic fabric of an organism from the inorganic elements woven through it. This lesson examines that sequence of weighings and burnings with the care it deserves, because the numbers it produces underpin the entire study of biomolecules.
The procedure is deliberately destructive: a small quantity of tissue, whether a leaf or a piece of liver, is weighed, dried, and finally burnt until nothing but a grey residue survives. Each stage of that process yields a distinct quantity — wet weight, dry weight and ash — and each quantity answers a different question about the sample. Alongside these measurements, the lesson considers the inorganic constituents that survive combustion, the ions and salts listed among the representative components of living tissues, and the important distinction between analysing a tissue for its elements and analysing it for its compounds.
This is the second lesson in a sequence that began with the general problem of how to analyse chemical composition, and it prepares the ground for the amino acids, fatty acids and lipids that follow. The material here is foundational rather than decorative: the percentages in the comparison of living and non-living matter, and the formulas of the inorganic constituents, are the kind of data that reappear throughout biology. Learners should read the lesson as a practical demonstration of a principle — that life is chemistry, and chemistry can be weighed.
On This Page
The Destructive Experiment: From Wet Weight to Ash
The analysis of inorganic constituents requires a different approach from the extraction and purification of organic compounds. Where organic analysis seeks to isolate a substance intact, the inorganic analysis described here consumes the sample entirely, converting its carbon compounds into gases and leaving behind only what cannot burn. The logic is one of subtraction: by removing water and then removing organic matter, the experimenter reveals the mineral skeleton that the tissue concealed. This destructive character is not a flaw but the very mechanism of the method, since it is only by destroying the organic matrix that the inorganic residue can be exposed and weighed.
Weighing the Living Tissue
The experiment begins with a small amount of living tissue — a leaf or a piece of liver serves as the standard example — which is weighed as it stands. This initial measurement is called the wet weight, and it includes everything the tissue contains at the moment of sampling, water included. Wet weight is therefore a record of the sample as a living system, fully hydrated and metabolically intact. It is a useful starting figure, but it is also a variable one, since the water content of a tissue shifts with its condition, its environment and the time elapsed since it was removed from the organism.
The choice of tissue matters for the interpretation of the result. A leaf, rich in water and photosynthetic tissue, will lose a large fraction of its mass on drying, while a denser organ such as liver presents a different profile of water and solid matter. The experiment does not require a large sample; a small amount suffices, provided it is weighed accurately. Precision at this first step is essential, because every subsequent quantity is derived by subtraction from the wet weight, and an error here propagates through the entire calculation.
Drying and Burning the Sample
Once the wet weight is recorded, the tissue is dried. All the water evaporates, and the material that remains gives the dry weight. This single step removes the most variable component of the sample and leaves the solid matter — the organic compounds and the inorganic elements and compounds together. The dry weight is a more stable and comparable quantity than the wet weight, because it no longer depends on how much water the tissue happened to contain when it was collected.
The dried tissue is then fully burnt. In this final stage, all the carbon compounds are oxidised to gaseous form — carbon dioxide and water vapour — and are removed from the sample. What remains is called ash, and this ash contains the inorganic elements such as calcium and magnesium that were present in the living tissue. The ash is the mineral residue of the organism, the portion of its chemistry that combustion cannot convert into gas. Weighing the ash completes the sequence and gives a direct measure of the inorganic content of the sample.
Reading the Three Weights: Wet, Dry and Ash
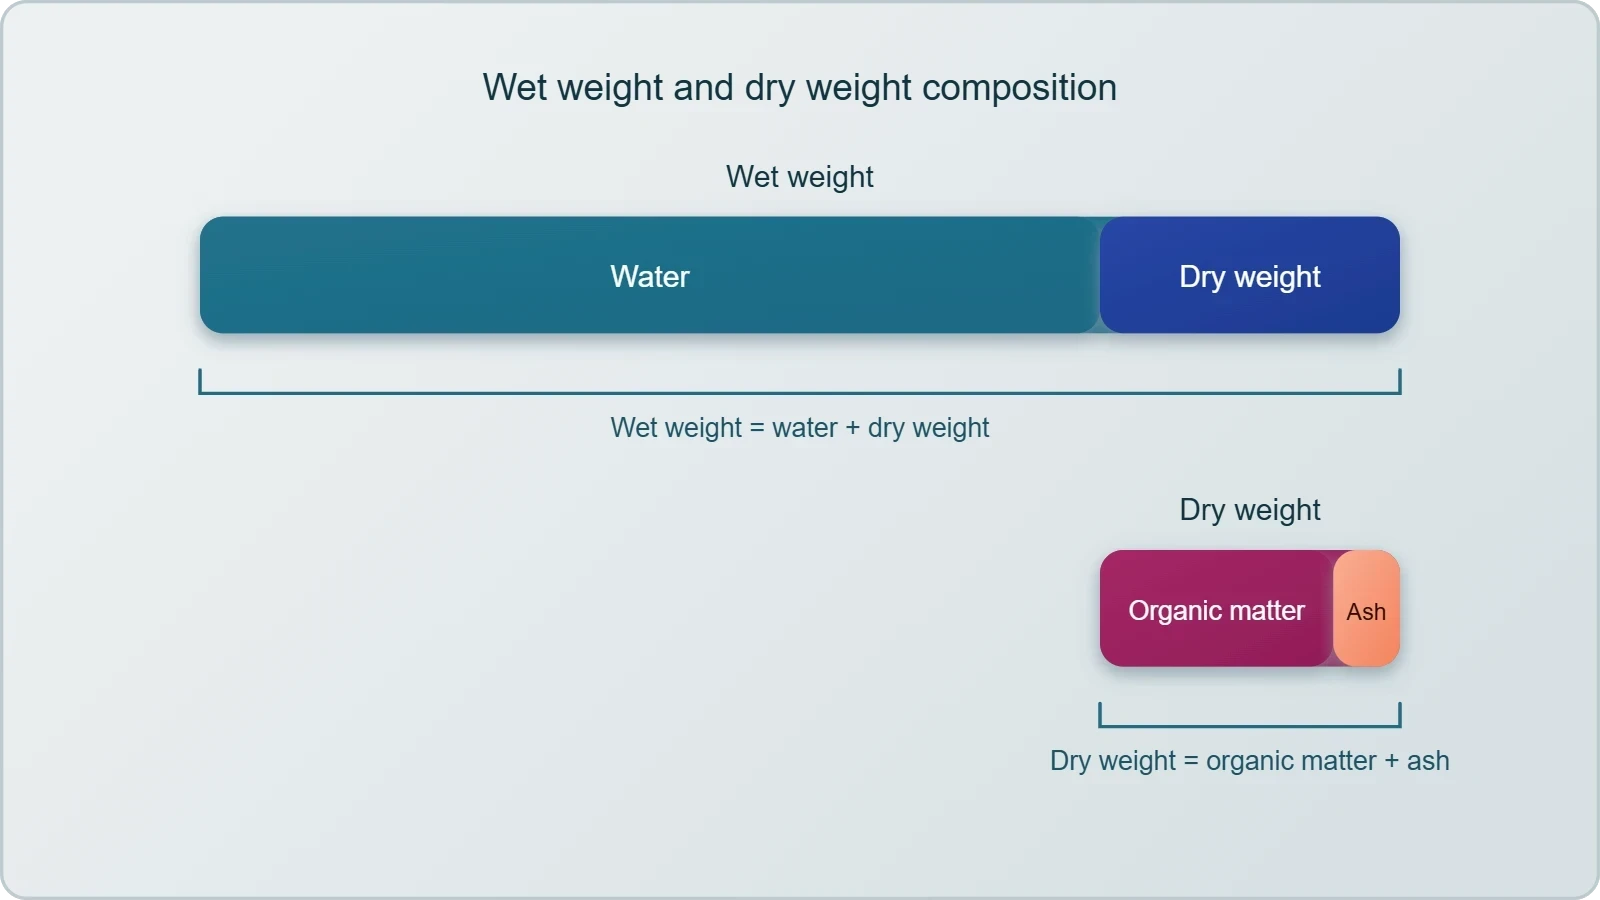
The three quantities produced by the experiment are not merely successive measurements; they are a set of nested differences, each of which isolates a component of the tissue. Wet weight contains everything. Dry weight contains everything except water. Ash contains only the inorganic elements. The gaps between them are therefore meaningful in themselves, and a learner who can read those gaps can describe the composition of a tissue in quantitative terms without ever isolating a single compound. The table below sets out the relationships in the order the experiment produces them.
What the Differences Reveal
The difference between wet weight and dry weight is the water content of the tissue, and it is often the largest single term in the calculation. The difference between dry weight and ash is the mass of organic matter that combustion converted into carbon dioxide and water vapour. The ash itself is the inorganic remainder. Read together, these three numbers give a rough composition of the sample: how much was water, how much was organic, and how much was mineral. No compound has been isolated, yet the tissue has been characterised in a way that is directly comparable between samples.
This is why the experiment is described as a slightly different but destructive approach. It does not tell the analyst which proteins or which sugars were present; it tells them how the tissue divides between water, organic matter and inorganic residue. That division is the necessary prelude to the more refined analyses that follow, in which compounds are extracted, separated, isolated and purified before their molecular formulas and probable structures are determined. The destructive experiment is coarse, but it establishes the frame within which finer measurements make sense.
Why Dry Weight Is Preferred for Comparison
Because wet weight varies with the water content of a sample, comparisons between tissues are more reliable when they are made on a dry-weight basis. Two leaves of equal wet weight may hold very different amounts of water, and therefore very different amounts of solid matter. Expressing a constituent as a fraction of dry weight removes that source of variation and allows the organic and inorganic content of different samples to be compared on equal terms. The principle is simple: measure against the stable part of the sample, not the part that changes with hydration.
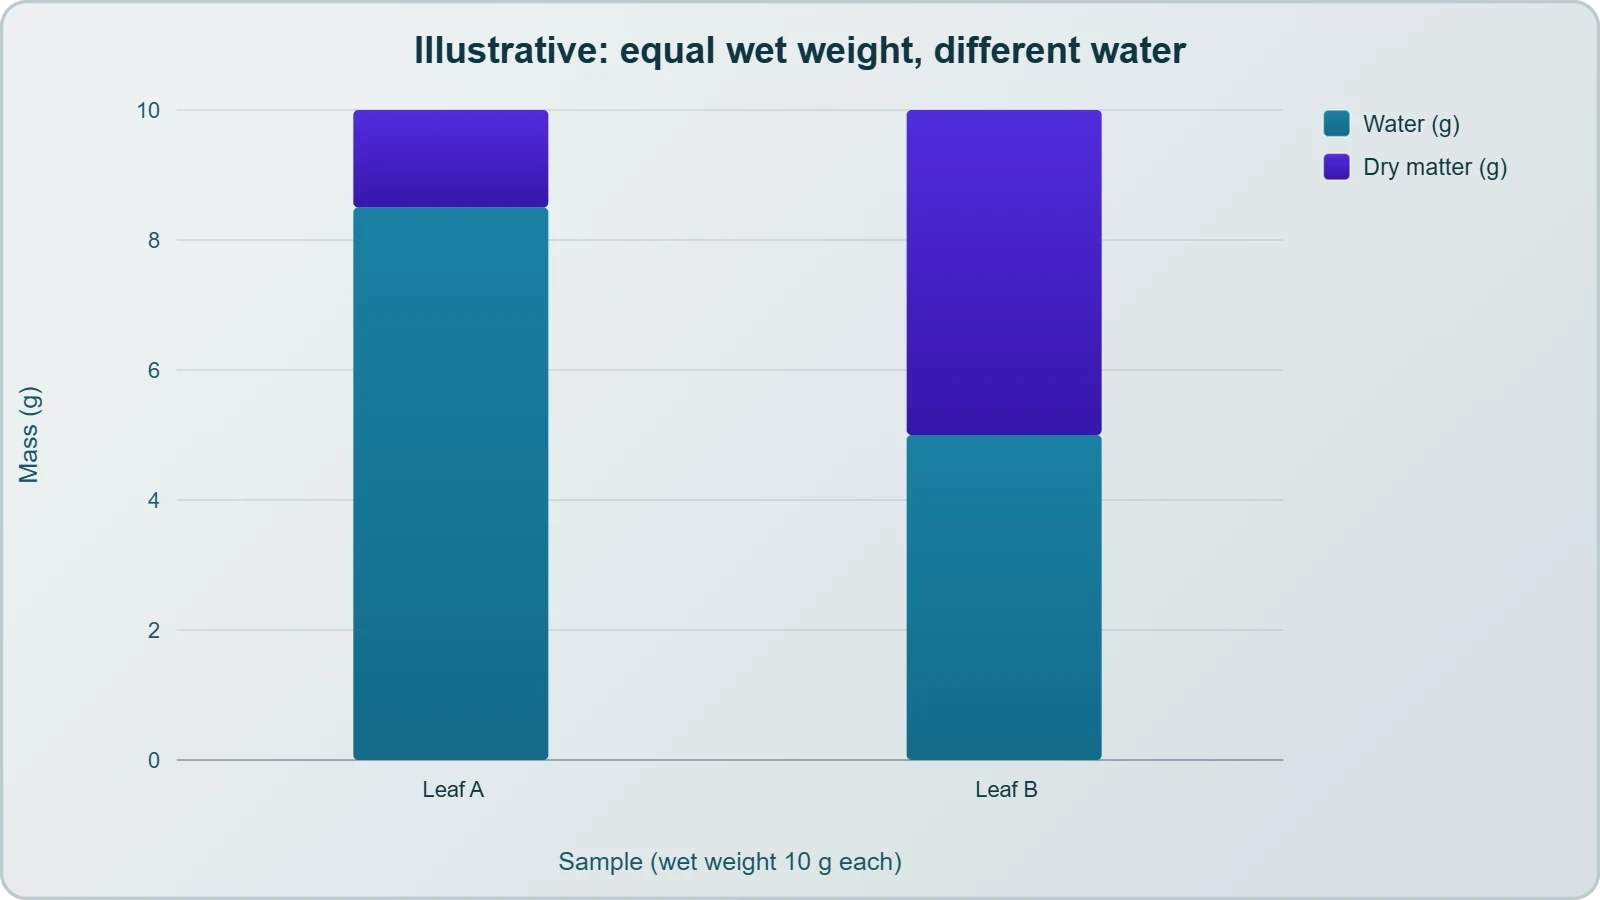
This habit of normalising to dry weight recurs throughout biology, from the composition of plant tissues to the mineral content of animal organs. It also explains why the ash figure is usually reported as a proportion of dry weight rather than of wet weight. The ash is a small fraction of the original sample, and stating it against the dry mass makes the number interpretable. Learners should carry this convention forward, because it will reappear whenever composition is discussed in quantitative terms.
Inorganic Constituents of Living Tissues
Living organisms contain inorganic elements and compounds alongside their carbon compounds, and the ash experiment is the direct demonstration of that fact. The inorganic constituents are not trace curiosities; they include ions that are essential to nerve function, muscle contraction, bone structure and the balance of fluids within and between cells. The material lists a representative set of these constituents, giving both the elemental ions and the compounds in which they commonly occur. The table below reproduces that list, and the discussion that follows explains how these constituents are detected and where they are found.
Ions and Salts in the Tissue
The representative list includes four metal ions — sodium, potassium, calcium and magnesium — together with water and a group of compounds. The ions are written with their charges: Na+, K+, Ca++ and Mg++. These are the dissolved inorganic species that the tissue contains, and they are the elements that remain in the ash after the organic matter has been oxidised away. Their presence in living tissues is the reason the ash experiment produces anything at all, and their identities are what elemental analysis of the ash reports.
The compounds listed are sodium chloride, calcium carbonate, and the phosphate and sulphate ions. These are the forms in which inorganic material commonly occurs in living tissues, and they illustrate that the inorganic fraction is not limited to bare elements. Water appears in the same list, which is a useful reminder that the drying step removes a substance that is itself inorganic, and that the dry weight is defined precisely by its absence. The list is representative rather than exhaustive, but it establishes the categories clearly.
The Acid-Soluble Fraction
Inorganic compounds such as sulphate and phosphate are also seen in the acid-soluble fraction of the tissue. This observation connects the ash experiment to the broader analytical scheme: when a tissue is treated and its components separated, a portion of the inorganic material appears among the substances that dissolve in acid. The acid-soluble fraction therefore carries both organic and inorganic constituents, and the analyst must be alert to both. The presence of sulphate and phosphate there confirms that these ions are genuine components of the tissue rather than artefacts of combustion.
The distinction matters because the ash experiment and the fractionation of tissue extracts answer different questions. Burning tells us which elements survive as minerals; extraction and separation tell us how those elements are combined and distributed among the soluble components. A complete picture of the inorganic constituents therefore draws on both approaches. The learner should note that the acid-soluble fraction is where the compound-level view of inorganic material becomes visible, complementing the element-level view supplied by the ash.
Elemental Analysis and Compound Analysis
Two kinds of analysis emerge from this material, and the distinction between them is one of the central lessons of the chapter. Elemental analysis gives the elemental composition of living tissues in the form of hydrogen, oxygen, chlorine, carbon and the other elements present. Analysis for compounds gives an idea of the kind of organic and inorganic constituents present in the tissue. The first answers the question "which elements?", the second answers "which substances?". Confusing the two leads to muddled conclusions, so the difference deserves careful attention.
What Elemental Analysis Reports
Elemental analysis reports composition in terms of elements: hydrogen, oxygen, chlorine, carbon and so on. It does not tell the analyst whether the carbon was part of a sugar, a protein or a lipid; it tells them only that carbon is present and in what proportion. This is the level at which the comparison of living and non-living matter is made, and it is the level at which the ash experiment speaks. The percentages in the comparison table are elemental percentages, and they are meaningful precisely because they abstract away from the particular compounds in which those elements occur.
The strength of elemental analysis is its generality. Because it does not depend on isolating any particular substance, it can be applied to any tissue and the results compared directly. Its limitation is equally clear: knowing that a tissue contains carbon, hydrogen, oxygen and nitrogen says nothing about how those elements are arranged. For that, the analyst must turn to compound analysis, which requires the extraction, separation, isolation and purification of individual substances before their molecular formulas and probable structures can be proposed.
What Compound Analysis Reports
Analysis for compounds gives an idea of the kind of organic and inorganic constituents present in living tissues. From a chemistry point of view, one can identify functional groups such as aldehydes, ketones and aromatic compounds. From a biological point of view, the same constituents are classified as amino acids, nucleotide bases, fatty acids and so on. The two viewpoints describe the same molecules at different levels of abstraction, and both are legitimate. The chemist asks what groups the molecule carries; the biologist asks what role the molecule plays.
This dual perspective is worth holding onto as the course proceeds. The inorganic constituents listed earlier belong to the compound-level view, since they are identified as specific ions and salts rather than as bare elements. The ash, by contrast, belongs to the elemental view, since it reports which elements survive combustion. A learner who can move between these two levels — element and compound, chemistry and biology — will find the later lessons on amino acids, proteins and enzymes far easier to follow.
Living and Non-Living Matter Compared
The comparison of elements present in non-living and living matter is one of the most striking tables in the chapter, and it repays close reading. The Earth's crust and the human body are built from the same elements, but in radically different proportions. Silicon dominates the crust; carbon dominates the body. Oxygen is abundant in both, but for different reasons and in different chemical settings. The table below reproduces the comparison, and the discussion that follows draws out what the numbers mean for the study of biomolecules.
Silicon, Carbon and the Signature of Life
The most instructive contrast in the table is between silicon and carbon. Silicon makes up 27.7 per cent of the Earth's crust by weight but is negligible in the human body. Carbon makes up only 0.03 per cent of the crust but 18.5 per cent of the body. The element that dominates the non-living world is almost absent from the living one, and the element that defines organic chemistry is a trace constituent of the rocks. This inversion is the chemical signature of life, and it is why the study of biomolecules is essentially the study of carbon compounds.
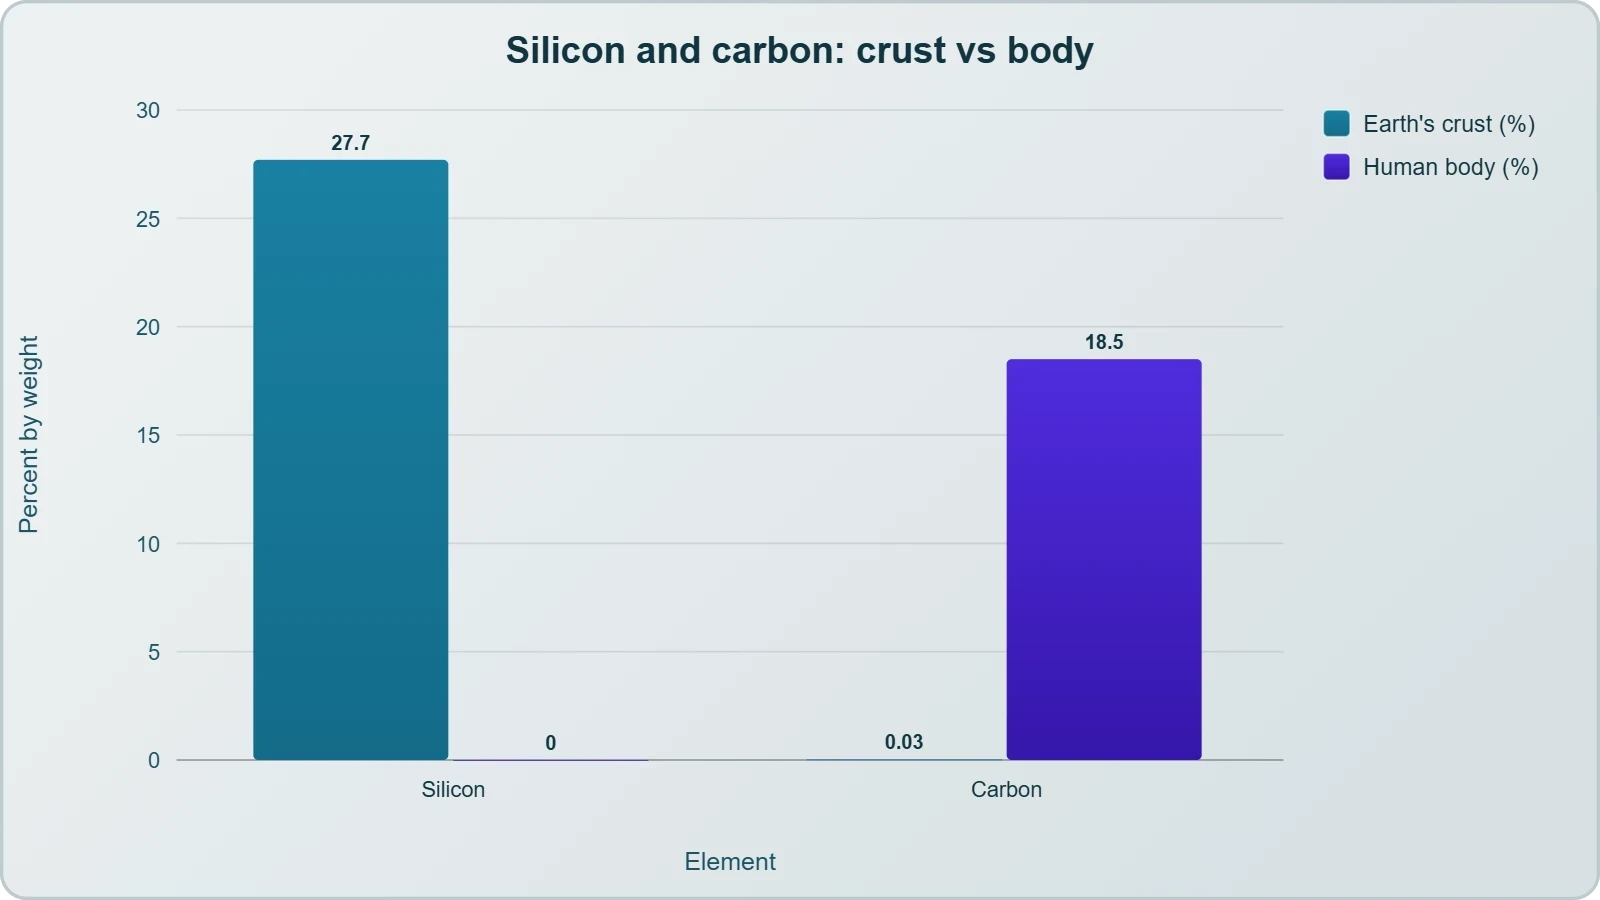
Oxygen is the one element that is abundant in both, at 46.6 per cent of the crust and 65.0 per cent of the body. Its prominence in the body reflects the ubiquity of water and of oxygen-containing functional groups in organic molecules. Hydrogen, at 9.5 per cent of the body against 0.14 per cent of the crust, tells a similar story: water and organic matter are hydrogen-rich. Nitrogen, present in only very little quantity in the crust, reaches 3.3 per cent of the body, where it is indispensable to proteins and nucleic acids.
Reading the Minor Elements
The remaining elements in the table illustrate the same principle at smaller scale. Sodium, calcium and magnesium are more abundant in the crust than in the body, yet they are essential to it, appearing among the inorganic constituents listed earlier. Sulphur is present at 0.3 per cent of the body against 0.03 per cent of the crust, a tenfold enrichment that reflects its role in certain amino acids and proteins. Each of these numbers is an elemental measurement of the kind the ash experiment produces, and each invites the question of what compound the element belongs to.
Learners should resist the temptation to read the table as a simple ranking of importance. An element's percentage by weight says nothing about its functional significance; calcium at 1.5 per cent of the body is no less essential than oxygen at 65.0 per cent. What the table does show is that living matter is a highly selective arrangement of the elements available in the environment, and that the selection is made at the level of compounds. The next lessons take up that compound-level story, beginning with amino acids, fatty acids and lipids.
Working Through the Numbers: A Quantitative View
The experiment becomes far more instructive when its arithmetic is made explicit. Suppose a tissue sample is weighed wet, dried and burnt, and the three masses are recorded. The water content is the difference between wet and dry weight, the organic content is the difference between dry weight and ash, and the ash is the inorganic residue. Expressing each as a percentage of the original wet weight, or of the dry weight, turns the raw masses into a composition profile. The worked example below uses illustrative figures to show how the calculation proceeds.
A Worked Example
Take a sample with a wet weight of 10.0 g. After drying, suppose the dry weight is 2.5 g; the water lost is therefore 7.5 g, or 75 per cent of the wet weight. After burning, suppose the ash weighs 0.25 g; the organic matter lost is 2.25 g, or 90 per cent of the dry weight. The ash is 10 per cent of the dry weight and 2.5 per cent of the wet weight. These figures are illustrative, but the arithmetic is exactly what the experiment demands, and it can be written compactly as a set of differences.
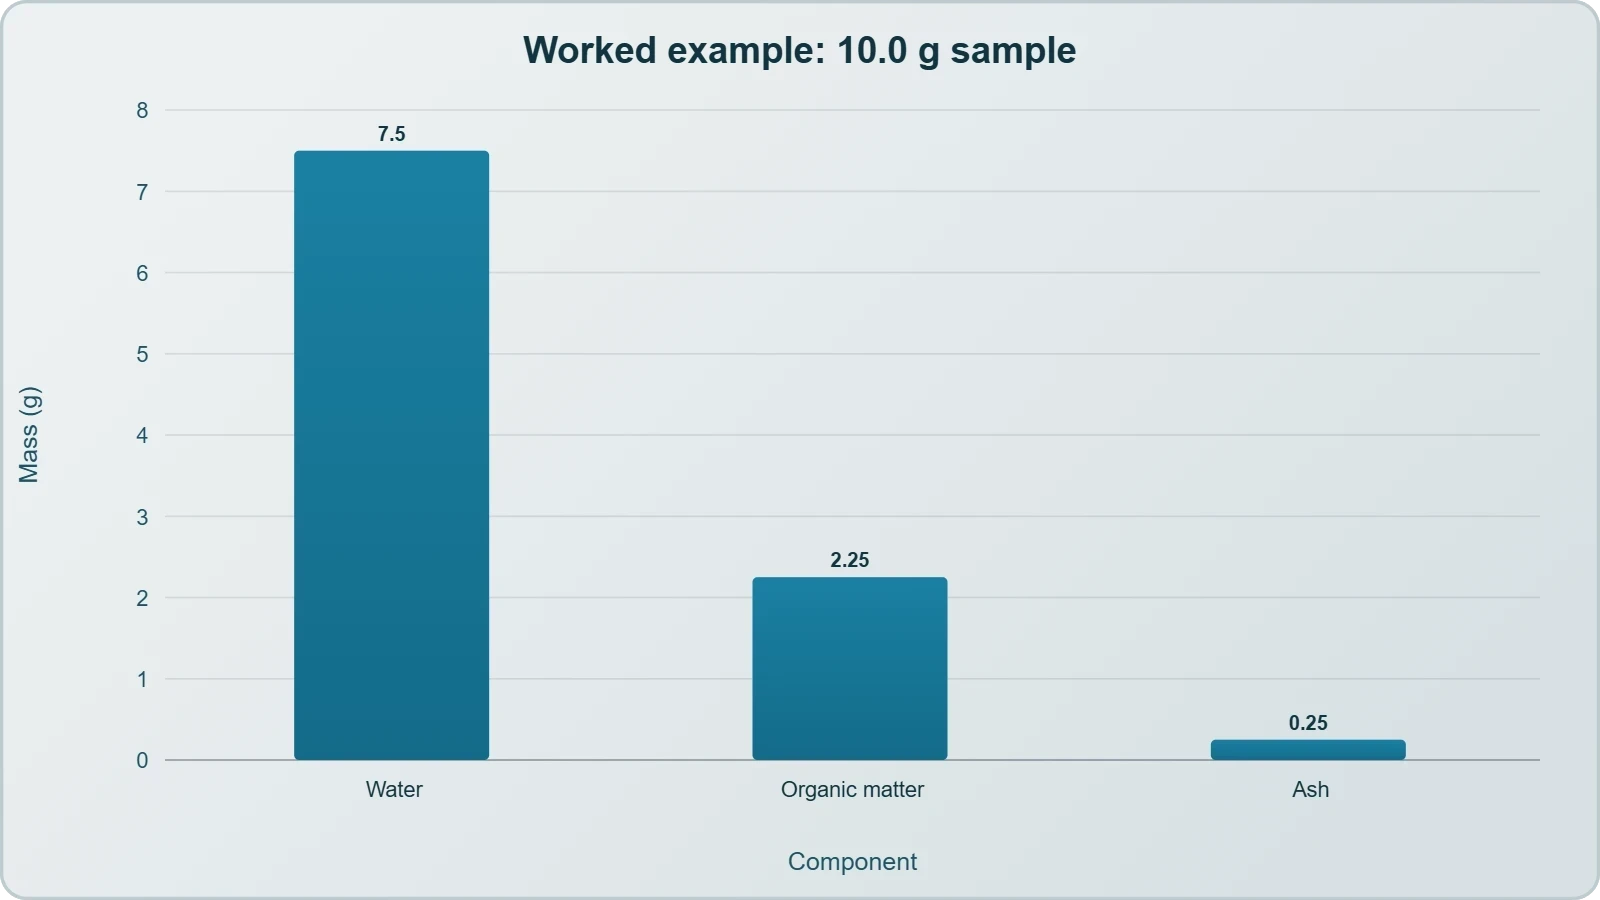
The percentage of ash on a dry-weight basis is then given by the ratio of ash to dry weight, multiplied by one hundred. This normalisation is the reason dry weight is preferred for comparison: it removes the water term, which is the most variable part of the sample. A learner who can perform these three subtractions and two ratios has mastered the quantitative core of the lesson, and can apply it to any tissue for which the three masses are known.
From Masses to Composition
The same logic extends to the elemental percentages in the comparison table. If the ash of a tissue is analysed for its elements, the result is an elemental composition expressed as percentages by weight, exactly as the table presents the composition of the crust and the body. The step from ash mass to elemental percentage is one of chemical analysis, and it is the point at which the destructive experiment hands over to the analytical techniques described in the previous lesson. The two approaches are complementary: one destroys the sample to reveal its minerals, the other isolates compounds to reveal their structures.
It is worth noting how much information the simple three-weight experiment yields. Without isolating a single compound, the analyst learns the water content, the organic content and the inorganic content of the tissue, and can compare these across samples on a dry-weight basis. The experiment is crude, but it is robust, and its results are the foundation on which the finer analyses of biomolecules are built. The next lesson turns to the compounds themselves, beginning with the amino acids and fatty acids that make up so much of the organic fraction.
Going Further
Two pieces of background help to place the experiment in a wider context. The first concerns the nature of ash: it is the mineral residue left after organic matter has been completely burned away, and its mass is therefore a direct measure of the inorganic material in the sample. The second concerns the choice of dry weight as a basis for comparison. Because wet weight varies with the water content of a sample, dry weight is often used when tissues are compared, since it removes the variable contribution of water and allows the solid matter to be assessed on equal terms.
These two ideas are not additions to the material so much as clarifications of it. The ash is what remains when combustion has done its work, and the dry weight is what remains when drying has done its work; each is defined by what has been removed. Keeping that logic in view makes the experiment easy to remember and easy to apply. The learner who understands why each stage removes a particular component will have little difficulty recalling the sequence, and will be well prepared for the compound-level analyses that follow.
Also Read
- No links available.
From our network :
- Mastering DB2 LUW v12 Tables: A Comprehensive Technical GuideComprehensive guide on DB2 LUW v12 tables. Explore CREATE TABLE syntax, BLU Acceleration, range partitioning, data types, and security features for IBM DB2 LUW v12.
- Trump Political Strategy How Geopolitical Stunts Serve As Media Diversions
- AI-Powered 'Precision Diagnostic' Replaces Standard GRE Score ReportsDiscover the new GRE Precision Diagnostic. Learn how AI-powered behavioral analytics and time-to-solve tracking are replacing standard GRE score reports to empower students.
- 98% of Global MBA Programs Now Prefer GRE Over GMAT Focus EditionExplore why 98% of global MBA programs now prefer the GRE over GMAT Focus. Learn about the shorter GRE format, verbal logic importance, and strategic versatility for students.
- 10 Physics Numerical Problems with Solutions for IIT JEEPrepare for IIT JEE with 10 physics numerical problems, complete with detailed solutions and conceptual explanations. Ideal for mastering kinematics, thermodynamics, electromagnetism, and optics.
- EV 2.0: The Solid-State Battery Breakthrough and Global Factory ExpansionDiscover the impact of the Solid-State Battery Breakthrough on the EV market. Learn about CATL and BYD stock growth, global factory expansion in Europe, and the future of EV 2.0 technology.
- Vite 6/7 'Cold Start' Regression in Massive Module GraphsIn-depth analysis of Vite 6/7 cold start regressions in massive module graphs. Learn about barrel file issues, pre-bundling optimizations, and how to improve Vite dev server performance.
- Mastering DB2 12.1 Instance Design: A Technical Deep Dive into Modern Database ArchitectureComprehensive guide to DB2 12.1 Instance Design. Explore architectural components, HADR setup, buffer pool tuning, and security policies for IBM DB2 12.1. Includes 10 functional SQL and Shell samples.
- Analyzing Trump Deportation Numbers Insights Into The 2026 Immigration Crackdown
RESOURCES
- biomolecules chapter 9 - NCERTncert.nic.inamount of a living tissue (say a leaf or liver and this is called wet weight) and dry it. All the water, evaporates. The…
- Comparative survival, biometric and nutritional components in ...ija.scholasticahq.comJul 1, 2026 ... ... matter to oxidize, leaving only inorganic minerals (ash). After cooling ... weight, STDW = soft tissue dry weight, TDW…
- How to Analyse Chemical Composition - Biology - GyanGhargyanghar.inThe Destructive Experiment - Wet Weight, Dry Weight and Ash. Living organisms also contain inorganic elements and compounds. Finding them needs a slightly ...
- Ash-free dry mass values for northcentral USA caddisflies (Insecta ...zookeys.pensoft.netJul 22, 2020 ... The difference between pre-incineration and post-incineration weights reflects the mass of the organic tissue volatized. AFDM is considered ...
- Total and Inorganic Arsenic in Freshwater Fish and Prawn in Thailandsciencedirect.comConcentrations of inorganic arsenic (on a wet weight basis) ranged from 0.010 μg/g in giant prawn (Macrobrachium rosenbergii) to 0.230 μg/g in striped snakehead ...
- Biomolecules Notes | Knowtknowt.com... wet weight) and dries it. All ... while analysis for compounds gives an idea of the kind of organic and inorganic constituents present…
- Effect of Habitat and Feeding Pattern on the Chemical Composition ...heraldopenaccess.usApr 4, 2025 ... ... composition and the accumulation of heavy elements in their muscle tissues ... wet weight Wet) for cadmium, nickel, copper…
- How to analyze chemical composition? | CK-12 Foundationflexbooks.ck12.orgMay 27, 2025 ... To identify inorganic matter in tissues, a destructive experimental method is used. First, the wet tissue is dried to remove…
- Review: the energetic value of zooplankton and nekton species of ...pmc.ncbi.nlm.nih.govAs DW includes inorganic material, expression of the energetic density in kJ g−1 ash-free dry weight (AFDW), representing the mass of only the organic…
- Tin and Inorganic Tin Compounds (Cicads 65, 2005) - Inchem.orginchem.org... wet weight. Tissue samples were digested in a mixture of ... (1987) reported inorganic tin concentrations of up to 4.4 mg/kg dry weight…
- Guidelines for the Classification and Coding of Industrial ... - TCEQtceq.texas.govAug 30, 2025 ... created for the purpose of determining Texas waste classification and do not contain information on all constituents found in a…
- TOXICOLOGICAL PROFILE FOR ARSENICatsdr.cdc.govA maximum arsenic concentration of 18 μg/kg wet weight was found in unpeeled carrots grown in soil, which contained a mean arsenic concentration of…
- Compost for blueberry plants: Testing and tipsextension.oregonstate.eduCompost moisture or water content is expressed as a percentage of compost wet weight. Compost with 40% moisture contains 60% dry matter. Composts with…
- Biomass pre-treatment for bioenergyieabioenergy.comTypical contents of critical inorganic components in (living) herbaceous biomass, and the ... dry weight. The costs of harvest and transport are estimated ...
- Zooplankton fixation and preservation - UNESCO Digital Libraryunesdoc.unesco.org... wet, dry and ash weights of squid mantle tissue. The most marked changes ... Wet weight (live weight=raw weight) Wet weight provides a…