Measurement is the heart of physics, yet no observation is ever perfectly exact. Every scientific measurement contains some degree of uncertainty. In experimental physics, the ability to understand accuracy, precision, absolute error, relative error, percentage error, and propagation of errors is essential for reporting scientific data correctly. These concepts are also frequently tested in competitive examinations such as JEE and NEET, especially in questions based on instruments, laboratory observations, dimensional analysis, and numerical approximations.
On This Page
Understanding Uncertainty and Measurement Errors
The Concept of True and Measured Values
Physics depends on measurement. Whenever we measure length, mass, time, temperature, current, voltage, or any other physical quantity, we are comparing an unknown quantity with an accepted standard. However, no measurement can be perfectly exact because every instrument has finite resolution, every observer has limitations, and every experimental setup is influenced by external conditions.
The value obtained during an experiment is called the measured value or observed value. The ideal value that represents the actual quantity is called the true value. In practice, the exact true value is rarely known. Therefore, when repeated observations are available, the arithmetic mean is commonly used as the best estimate of the true value.
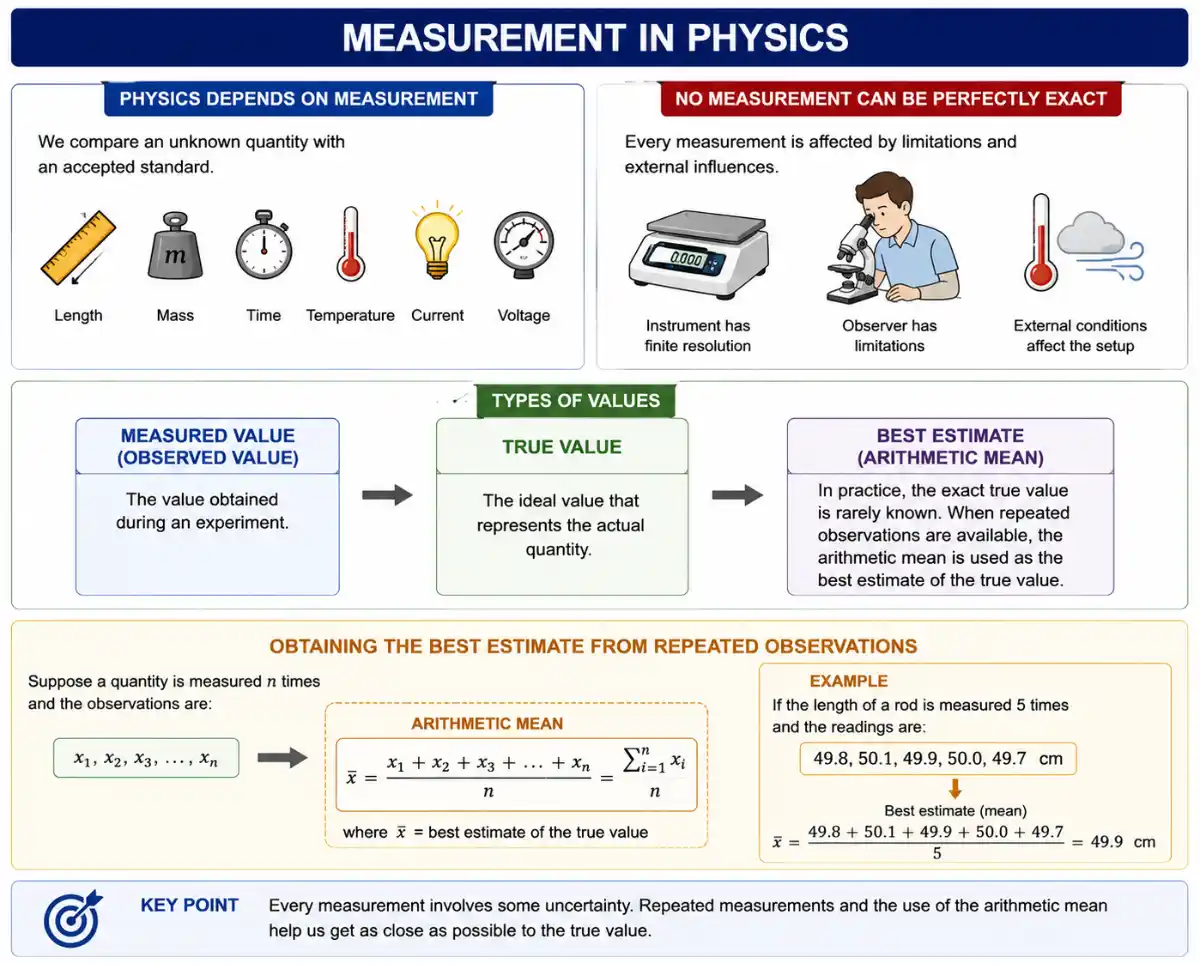
If ##a_1, a_2, a_3, \ldots, a_n## are ##n## readings of the same physical quantity, then the mean value is:
The difference between a measured value and the true value is called error. If the true value is known, the absolute magnitude of error in a single reading can be written as:
Since the true value is usually unknown in ordinary laboratory work, the mean value is used as the reference. This is why error analysis often begins by calculating ##a_{\text{mean}}##. The deviation of every reading from this mean tells us how much the readings fluctuate around the most probable value.
Accuracy Versus Precision in Scientific Data
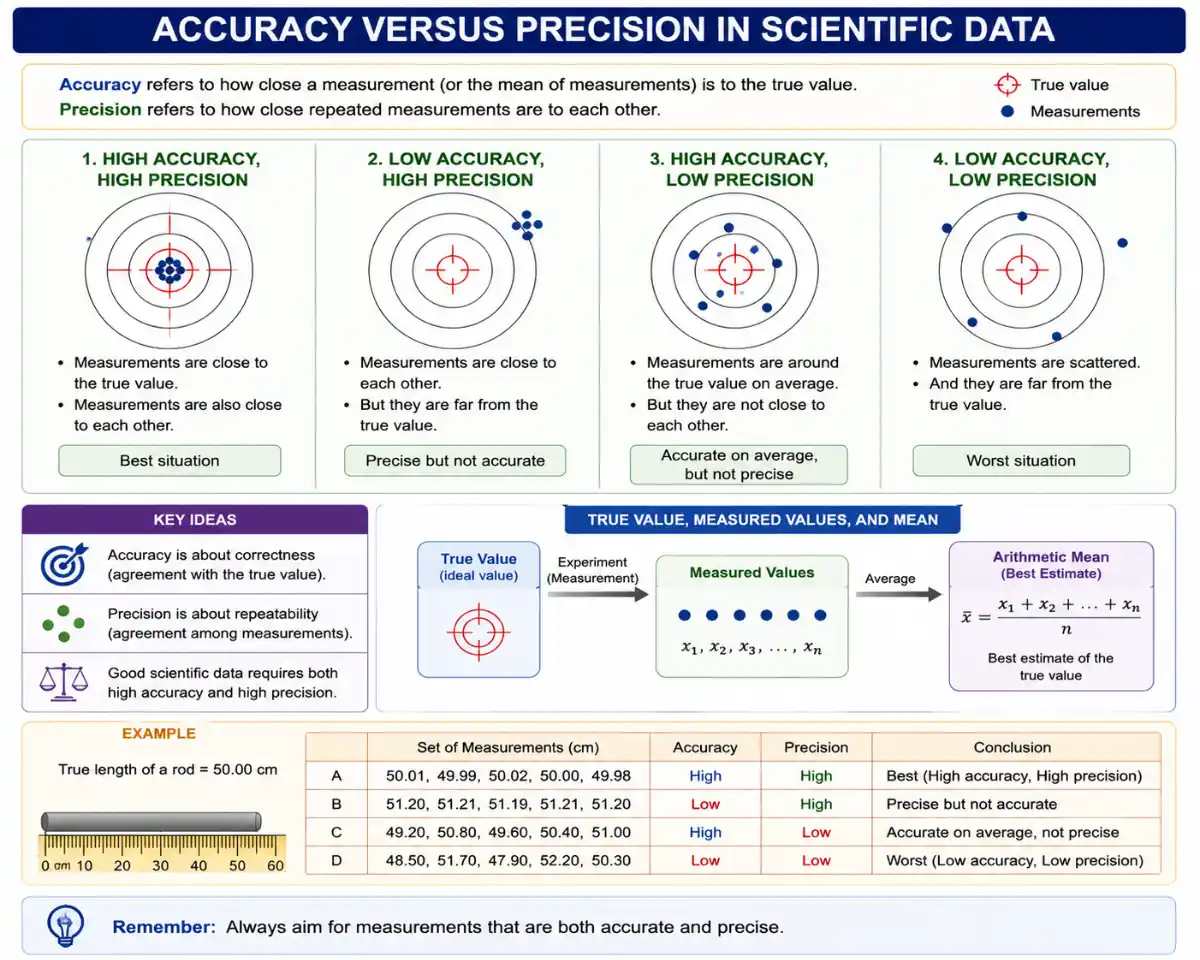
Accuracy describes how close a measured value is to the accepted true value. A highly accurate measurement has very little systematic deviation from the actual value. For example, if the true length of a rod is ##10.00\text{ cm}## and an instrument repeatedly gives values close to ##10.00\text{ cm}##, the measurement is accurate.
Precision describes how close repeated readings are to one another. A set of values may be precise even if it is not accurate. For example, readings such as ##9.82\text{ cm}##, ##9.83\text{ cm}##, and ##9.82\text{ cm}## are very close to one another, so they are precise. But if the actual value is ##10.00\text{ cm}##, they are not accurate.
A simple target-board analogy helps clarify the difference. Accuracy means the shots are close to the bullseye. Precision means the shots are tightly grouped. A good experiment requires both: the readings should be close to the accepted value and also close to one another.
| Concept | Meaning | Typical Cause of Poor Result | Example |
|---|---|---|---|
| Accuracy | Closeness of a measured value to the true or accepted value. | Systematic error, zero error, faulty calibration, biased method. | A scale gives ##10.01\text{ cm}## for a rod whose accepted length is ##10.00\text{ cm}##. |
| Precision | Closeness of repeated readings to one another. | Random fluctuations, poor least count, unstable observations. | Repeated readings such as ##9.81\text{ cm}##, ##9.82\text{ cm}##, and ##9.81\text{ cm}## are tightly grouped. |
| High Accuracy, Low Precision | The average may be close to the true value, but individual readings are scattered. | Large random error but small systematic error. | Readings fluctuate around the accepted value but are not consistent. |
| High Precision, Low Accuracy | Readings are close to one another but shifted away from the true value. | Systematic error or incorrect calibration. | A screw gauge with zero error gives consistently shifted readings. |
Classifying Errors in Physical Measurements
Systematic Errors and Their Origin
Systematic errors are errors that occur in a definite direction. They may be consistently positive or consistently negative. These errors follow a pattern and usually arise because of faulty instruments, incorrect calibration, environmental influence, or a biased method of observation.
A common example is zero error in an instrument. If a vernier caliper shows a non-zero reading even when its jaws are closed, every measurement will be shifted by a fixed amount. Repeating the measurement many times does not remove this error because the same bias is present in every reading.
Systematic errors can be reduced by improving the experimental method. Calibration, zero correction, proper alignment of the observer's eye, shielding from temperature variation, and use of better instruments can greatly improve accuracy.
Random Errors and Repeated Measurements
Random errors are unpredictable errors that vary in magnitude and direction from one observation to another. They may arise due to small vibrations, fluctuations in voltage, minor changes in temperature, limitations of human reaction time, or unavoidable variations in the experimental environment.
Unlike systematic errors, random errors cannot be completely removed. However, their effect can be reduced by taking many observations and calculating the mean. The central idea is that positive and negative fluctuations tend to cancel one another when a large number of readings is taken.
The spread of readings around the mean gives us a practical estimate of uncertainty. If the readings are tightly clustered, the measurement is precise. If they are widely scattered, the uncertainty is larger and the precision is lower.
Mathematical Formulation of Measurement Errors
Absolute Error and Mean Absolute Error
Suppose ##a_i## represents the ##i^{\text{th}}## reading and ##a_{\text{mean}}## represents the mean value of all readings. The absolute error in the ##i^{\text{th}}## reading is:
The absolute value sign is essential. Without it, positive and negative deviations may cancel each other, giving a misleadingly small error. Error represents distance from the mean, so it must be taken as a positive quantity.
The mean absolute error is the average of all individual absolute errors:
Equivalently, using summation notation:
A measured physical quantity is commonly reported in the form:
| Quantity | Meaning | Correct Formula |
|---|---|---|
| Individual Reading | A single measured value obtained in an experiment. | ##a_i## |
| Mean Value | The arithmetic average of all observations; used as the best estimate of the true value. | ##a_{\text{mean}} = \dfrac{1}{n}\sum_{i=1}^{n}a_i## |
| Absolute Error | The positive deviation of one reading from the mean value. | ##\Delta a_i = \left|a_i - a_{\text{mean}}\right|## |
| Mean Absolute Error | The average of all absolute errors; represents the uncertainty of the measurement set. | ##\Delta a_{\text{mean}} = \dfrac{\sum_{i=1}^{n}\left|a_i - a_{\text{mean}}\right|}{n}## |
| Final Reported Value | The measured value written with its uncertainty. | ##a = a_{\text{mean}} \pm \Delta a_{\text{mean}}## |
Worked Example for Mean Absolute Error
Suppose five measurements of the diameter of a small sphere are:
First calculate the mean value:
Now calculate the absolute deviation of every reading from ##2.42\text{ cm}##.
| Reading Number | Observed Value ##a_i## | Absolute Error ##\Delta a_i = \left|a_i - a_{\text{mean}}\right|## |
|---|---|---|
| 1 | ##2.41\text{ cm}## | ##\left|2.41 - 2.42\right| = 0.01\text{ cm}## |
| 2 | ##2.43\text{ cm}## | ##\left|2.43 - 2.42\right| = 0.01\text{ cm}## |
| 3 | ##2.42\text{ cm}## | ##\left|2.42 - 2.42\right| = 0.00\text{ cm}## |
| 4 | ##2.44\text{ cm}## | ##\left|2.44 - 2.42\right| = 0.02\text{ cm}## |
| 5 | ##2.40\text{ cm}## | ##\left|2.40 - 2.42\right| = 0.02\text{ cm}## |
Therefore:
The final result is:
Visualising the Spread of Readings
The following illustration shows how the five readings are distributed around the mean value ##2.42\text{ cm}##. Readings close to the central line indicate better precision, while larger spread indicates larger uncertainty.
Relative Error and Percentage Error
Relative Error
Absolute error has the same unit as the measured quantity. However, sometimes we need to compare the quality of two measurements having different magnitudes or different units. In such cases, relative error is more useful because it expresses uncertainty as a fraction of the measured value.
Relative error is defined as:
Relative error is dimensionless because both numerator and denominator have the same unit. A smaller relative error indicates a more reliable measurement.
Percentage Error
Percentage error is the relative error multiplied by ##100##. It is often preferred because it expresses uncertainty in a more readable form.
For the example above:
This means the uncertainty is less than ##1\%## of the measured value, which indicates a reasonably precise measurement for many school-level laboratory experiments.
Propagation of Errors and Exam Application
Error Propagation in Addition and Subtraction
When two physical quantities are added or subtracted, their absolute errors are added. Suppose:
If ##Z = A + B## or ##Z = A - B##, then the maximum absolute error in ##Z## is:
Notice that the errors are added even in subtraction. This is because maximum possible uncertainty does not depend on whether the measured quantities are added or subtracted.
Propagation in Multiplication, Division and Powers
For multiplication and division, relative errors are added. If:
then:
If a quantity is raised to a power, the relative error is multiplied by that power. For example, if ##Z = A^n##, then:
For the more general expression:
the maximum relative error is:
| Operation | Result Form | Error Rule | Exam Reminder |
|---|---|---|---|
| Addition | ##Z = A + B## | ##\Delta Z = \Delta A + \Delta B## | Add absolute errors. |
| Subtraction | ##Z = A - B## | ##\Delta Z = \Delta A + \Delta B## | Absolute errors still add. |
| Multiplication | ##Z = AB## | ##\dfrac{\Delta Z}{Z} = \dfrac{\Delta A}{A} + \dfrac{\Delta B}{B}## | Add relative errors. |
| Division | ##Z = \dfrac{A}{B}## | ##\dfrac{\Delta Z}{Z} = \dfrac{\Delta A}{A} + \dfrac{\Delta B}{B}## | Add relative errors, not absolute errors. |
| Power | ##Z = A^n## | ##\dfrac{\Delta Z}{Z} = n\dfrac{\Delta A}{A}## | Multiply relative error by the exponent. |
Worked Example for Error Propagation
A rectangular plate has length ##L = 5.00 \pm 0.02\text{ cm}## and breadth ##B = 3.00 \pm 0.01\text{ cm}##. Find the percentage error in its area.
Area is given by:
Since area is the product of two measured quantities, relative errors add:
Substitute the given values:
Therefore, the percentage error is:
The area itself is:
The absolute error in area is approximately:
Hence, the result may be written as:
Points to Remember for JEE and NEET
- Use ##a_{\text{mean}}## as the best estimate of the true value when several readings are given.
- Always use absolute value while calculating individual absolute error: ##\Delta a_i = \left|a_i - a_{\text{mean}}\right|##.
- Report experimental results in the form ##a = a_{\text{mean}} \pm \Delta a_{\text{mean}}##.
- For addition and subtraction, add absolute errors.
- For multiplication and division, add relative errors.
- For powers, multiply the relative error by the power.
- Percentage error makes it easier to compare measurements of different magnitudes.
RESOURCES
- Factors affecting blood glucose monitoring: sources of errors in ...pubmed.ncbi.nlm.nih.govJul 1, 2009 ... ... errors to the system evaluation of blood glucose. In this review, I discuss the measurement of error in blood…
- Errors in Measurement - Math is Funmathsisfun.comThe Absolute Error is the difference between the actual and measured value. But when measuring we don't know the actual value! So we use…
- BMI-related errors in the measurement of obesity - PubMedpubmed.ncbi.nlm.nih.govBody mass index (BMI) has various deficiencies as a measure of obesity, especially when the BMI measure is based on self-reported height and weight.
- Measurement Errors Types Causes & How to Reduce Them | MTIvitrek.comAug 28, 2017 ... A measurement error is the difference between a measured value and the true value of the quantity being measured.
- Observational error - Wikipediaen.wikipedia.orgObservational error (or measurement error) is the difference between a measured value of a quantity and its unknown true value. Such errors are inherent…
- Efficient separate quantification of state preparation errors and ...quantum-journal.orgMay 5, 2025 ... Current noisy quantum computers have multiple types of errors, which can occur in the state preparation, measurement/readout, and gate operation ...
- Efficient separate quantification of state preparation errors ... - arXivarxiv.orgOct 29, 2023 ... Current noisy quantum computers have multiple types of errors, which can occur in the state preparation, measurement/readout, and gate operation ...
- Accuracy, precision of instruments and errors in measurementbyjus.comAn error may be defined as the difference between the measured and actual values. For example, if the two operators use the same device…
- Measurements and Error Analysis - WebAssignwebassign.netMeasurement error is the amount of inaccuracy. Precision is a measure of how well a result can be determined (without reference to a theoretical…
- Measurement Error - an overview | ScienceDirect Topicssciencedirect.comMeasurement error is defined as the difference between the true value and the measured value, which arises from imperfections in the measurement method, ...
- Theory of random measurement errors: concepts, uses, and misusespmc.ncbi.nlm.nih.govJun 30, 2025 ... Measurement errors can be systematic or random. Systematic errors are specific of every measurement procedure and are usually manifested as ...
- Errors in Measurement - GeoGebrageogebra.orgApp Downloads. Errors in Measurement. Author:Anthony OR 柯志明. Topic:Percentages. 中文版:https://ggbm.at/10652631. GeoGebra Applet Press Enter to start ...
- Modeling and Compensation of Inertial Sensor Errors in ... - MDPImdpi.comMay 30, 2023 ... ... errors (i.e., bias, scale factor error, and installation error) in a conventional inertial measurement unit (IMU) error model on…
- Potential impact of systematic and random errors in blood pressure ...pmc.ncbi.nlm.nih.govFeb 9, 2022 ... Measuring BP with systematic or random errors may result in the misclassification of high BP for a substantial proportion of…
- How many measurement error would be best? - Dynare Forumforum.dynare.orgNov 17, 2015 ... Using “Measurement Errors as a Special Case of Exogenous variables” is equivalent to regular measurement error using Dynare capabilities.
0 Comments