Ecological pyramids translate an abstract idea — that feeding relationships organise living communities into tiers — into a visual grammar that students can read at a glance. The pyramid shape itself is intuitive: a broad base of producers narrows toward a small apex of top carnivores, mirroring the progressive loss of energy and matter as food passes from one trophic level to the next. Yet this apparent simplicity conceals real analytical subtlety, because the same ecosystem can yield an upright pyramid of number, an inverted pyramid of biomass, and an invariably upright pyramid of energy, all at once. Understanding why these three representations diverge is the central intellectual task of this lesson.

Building directly on the preceding treatment of energy flow and trophic levels, the discussion here moves from the mechanics of transfer to the accounting of what is stored and counted at each level. The standing crop — the mass of living material present at a given moment, measured as biomass or as numbers per unit area — becomes the raw quantity that pyramids of number and biomass attempt to display. Energy pyramids, by contrast, record rates rather than stocks, which is precisely why they obey thermodynamic constraints that the other two do not. Grasping this distinction between a snapshot and a flow is what separates a superficial reading of pyramid diagrams from genuine ecological reasoning.
Beyond definitions, the lesson confronts the limitations that make pyramids imperfect instruments. Real food webs are reticulate, species occupy multiple trophic positions simultaneously, and saprophytes are quietly excluded from the standard diagram despite their indispensable role in recycling detritus. We will examine inverted pyramids in aquatic systems, the paradox of phytoplankton supporting a far larger biomass of zooplankton and fish, and the rapid turnover that resolves that paradox. We will also construct a pyramid of energy from supplied values, explore trophic spectra as a more faithful alternative, and identify the common mistakes that trip up examination candidates and field ecologists alike.
On This Page
- The Three Faces of the Ecological Pyramid
- Upright Pyramids and the Ten Per Cent Law
- Inverted Pyramids: When the Shape Flips
- Limitations That Undermine the Pyramid Model
- Common Mistakes and Examination Traps
- From Pyramids to Quantitative Ecosystem Analysis
- Reading Pyramids Critically in Field and Classroom
The Three Faces of the Ecological Pyramid
An ecological pyramid expresses the feeding relationship between organisms at successive trophic levels in terms of number, biomass, or energy. The base always represents the producers, the first trophic level, while the apex represents the tertiary or top-level consumers. This tripartite scheme — pyramid of number, pyramid of biomass, and pyramid of energy — is the standard framework taught in ecology, and each variant answers a different question about the community. Number pyramids ask how many individuals occupy each tier; biomass pyramids ask how much living material is present; energy pyramids ask how much energy flows through each tier per unit time. Confusing these questions is the most common source of error.
Number, Biomass, and Energy Defined
The pyramid of number counts individuals at each trophic level within a defined area. In a grassland, roughly six million plants may support a few hundred thousand herbivorous insects, which in turn support a few thousand small predators, and ultimately only three top carnivores. The pyramid of biomass measures the mass of living organisms, expressed as fresh or dry weight per unit area. Dry weight is the more accurate currency because water content varies enormously between organisms and between seasons, inflating fresh-weight estimates unpredictably. The pyramid of energy records the energy content passing through each level over a specified period, usually annually per unit area, and is therefore a rate rather than a stock.

Each representation carries an implicit instruction: any calculation of energy content, biomass, or numbers must include all organisms at that trophic level. Generalisations collapse if only a few individuals are sampled. A further complication is that a single organism may occupy more than one trophic level simultaneously. A sparrow acts as a primary consumer when it eats seeds, fruits, and peas, but as a secondary consumer when it eats insects and worms. The trophic level, therefore, represents a functional position rather than a species identity, and human beings routinely function at several levels within the same food chain.
Standing Crop and the Stock-Flow Distinction
The standing crop is the mass of living material present at a particular time, measured either as biomass or as number per unit area. It is a stock — a snapshot of what exists at one instant — whereas productivity and energy flow are rates describing how quickly that stock is built or consumed. This distinction explains why biomass pyramids and energy pyramids can disagree so dramatically. A small standing crop of phytoplankton may be turning over every few days, delivering a large cumulative energy flux to herbivores, while a large standing crop of slow-growing trees delivers comparatively little energy per unit area despite its enormous mass.
Measurement conventions matter here. Biomass expressed as dry weight removes the confounding influence of water, allowing meaningful comparison between a succulent aquatic alga and a woody terrestrial shrub. Ecologists also distinguish standing crop from production: a forest may hold hundreds of tonnes of biomass per hectare while adding only a few tonnes annually. When students conflate the two, they misread inverted biomass pyramids as violations of thermodynamic law, when in fact no violation exists — the stock is small, but the flow is large and rapid.
Upright Pyramids and the Ten Per Cent Law
In most ecosystems, all three pyramids are upright: producers exceed herbivores in number and biomass, herbivores exceed carnivores, and energy at each lower level always exceeds that at the level above. The restriction on the number of trophic levels in a grazing food chain follows from the ten per cent law, which states that only about ten per cent of the energy at one level is transferred to the next. With such steep attenuation, a chain of producer, herbivore, primary carnivore, and secondary carnivore is about as long as nature can sustain. Each additional level would require an impossibly large base of primary production.
Why Energy Transfer Is So Lossy
The ten per cent figure is an approximation, but the direction of loss is universal. At every transfer, energy is dissipated as heat through respiration, lost in unconsumed tissues, and excreted as waste. Assimilation efficiency varies widely — herbivores typically assimilate far less of their ingested food than carnivores do — yet the cumulative effect is always a sharp decline. This is why the energy pyramid is the most fundamental of the three: it reflects the thermodynamic reality that governs the entire system, while number and biomass pyramids reflect contingent ecological arrangements that can be rearranged by circumstance.
Detritus food chains deserve a note of contrast. Because dead organic matter accumulates and is processed by decomposers with their own energetic costs, the question of whether the same ten per cent restriction applies is genuinely interesting. In practice, detritus-based systems can support substantial decomposer biomass because the detrital pool is continuously replenished, but the underlying thermodynamic constraint on energy transfer remains. The number of functional levels may differ, yet no arrangement escapes the second law of thermodynamics.
Constructing a Pyramid of Energy: A Worked Example
Consider a hypothetical grassland where producers capture ##4.0 \times 10^{6}\ \text{kcal m}^{-2}\text{yr}^{-1}## of energy as net primary production. Applying a ten per cent transfer efficiency at each step, herbivores receive ##4.0 \times 10^{5}##, primary carnivores receive ##4.0 \times 10^{4}##, and secondary carnivores receive ##4.0 \times 10^{3}##. Plotting these four values as horizontal bars of decreasing length produces the classic upright energy pyramid. The arithmetic is simple, but the ecological message is profound: the top predator subsists on one-thousandth of the energy captured by plants.

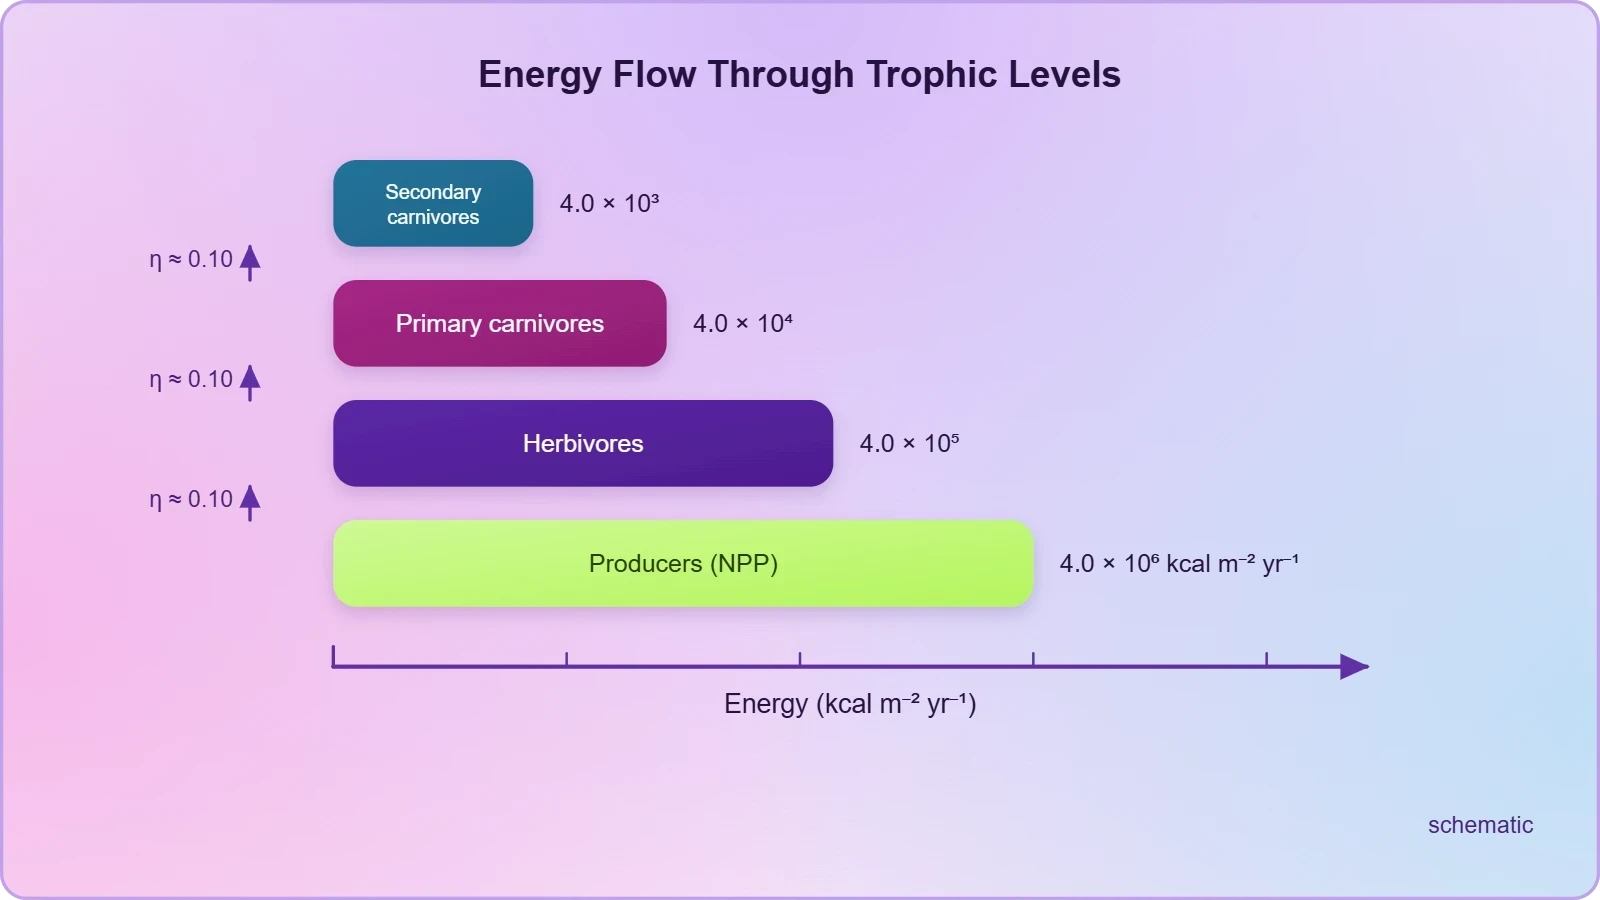
In this expression, ##E_n## is the energy at trophic level ##n## and ##\eta## is the ecological efficiency. The geometric decay is unmistakable: after four transfers, only ##0.1^4 = 0.0001## of the original energy remains. Real efficiencies range from roughly five to twenty per cent depending on the organisms involved, but the exponential form of the decline holds regardless. Students should practise varying ##\eta## to see how a fifteen per cent efficiency permits longer chains than a five per cent efficiency, which explains why productive aquatic systems sometimes sustain an extra trophic level.
Inverted Pyramids: When the Shape Flips
The generalisation that pyramids are upright admits important exceptions, and these exceptions are where ecological insight deepens. Count the insects feeding on a single large tree, then add the small birds that eat the insects and the larger birds that eat the smaller ones, and the resulting pyramid of number is inverted at its base: one producer supports a vast number of primary consumers. The tree's enormous size compensates for its numerical scarcity, which is why number pyramids in forest ecosystems are often spindle-shaped rather than triangular. The shape reflects counting conventions, not energetic impossibility.
The Aquatic Biomass Paradox
The pyramid of biomass in the sea is generally inverted because the biomass of fishes far exceeds that of the phytoplankton that ultimately support them. At first glance this appears to be a paradox: how can a small standing crop of producers sustain a much larger standing crop of consumers? The resolution lies in turnover rate. Phytoplankton reproduce and are consumed with extraordinary rapidity, dividing every day or two, so a small standing stock generates an enormous cumulative production over a season. The fishes, by contrast, grow slowly and accumulate biomass over years. The stock is small; the flow is large.

This is precisely why the energy pyramid remains upright even where the biomass pyramid inverts. Energy flux through phytoplankton exceeds energy flux through fish, exactly as thermodynamics demands. The inversion is an artefact of measuring a snapshot rather than a rate. A useful analogy is a small shop with rapid stock turnover generating more annual revenue than a warehouse holding slow-moving goods. Ecologists quantify this with the production-to-biomass ratio, which is high for phytoplankton and low for fish, and the ratio neatly predicts which systems will display inverted biomass pyramids.

Why Energy Pyramids Never Invert
The pyramid of energy is always upright and can never be inverted, because when energy flows from one trophic level to the next, some energy is always lost as heat at each step. This is a direct consequence of the second law of thermodynamics: no energy transformation is perfectly efficient, and biological systems are no exception. Each bar in the energy pyramid indicates the amount of energy present at each trophic level in a given time, or annually per unit area. Because the loss is unavoidable, the energy at any level must be less than the energy at the level below it.
Students sometimes ask whether a highly efficient predator could reverse the pattern. It cannot. Even a predator assimilating ninety per cent of its prey's energy would still lose the remainder, and the prey itself lost energy in obtaining its food. The cumulative losses compound downward, guaranteeing that the apex always holds less energy than the base. This makes the energy pyramid the most reliable of the three representations and the one most useful for comparing ecosystems, because it is immune to the counting and sampling artefacts that distort number and biomass pyramids.
Limitations That Undermine the Pyramid Model
However elegant, ecological pyramids carry structural limitations that every serious student must recognise. The first is that they do not accommodate species belonging to two or more trophic levels. A sparrow eating seeds and insects simultaneously occupies two functional positions, yet the pyramid forces it into one. The second is that pyramids assume a simple food chain, something that almost never exists in nature. Real communities form food webs, with reticulate connections that a single triangular diagram cannot represent. The third is that saprophytes — the decomposers and detritivores — are given no place in ecological pyramids, even though they play a vital role in the ecosystem by recycling nutrients from detritus.
The Problem of Discrete Trophic Levels
Pyramids assume that trophic levels are discrete and well-defined, which is an oversimplification. In reality, omnivory is widespread, feeding preferences shift with season and life stage, and many organisms feed across several levels simultaneously. A generalist predator may function as a secondary consumer in one season and a tertiary consumer in another. The pyramid's rigid horizontal strata therefore misrepresent the fluid, overlapping structure of real feeding networks. This is not a trivial technicality; it affects how we model energy flow, predict the effects of species loss, and design conservation strategies.
An additional limitation concerns scale and sampling. Because pyramids require counting or weighing all organisms at a trophic level, they are labour-intensive and prone to error. Rare but ecologically important species may be missed entirely, and seasonal variation can swing biomass estimates by orders of magnitude. The pyramid also says nothing about the rate of energy transfer, the resilience of the system, or the functional roles of individual species. It is a coarse summary, useful for teaching and for broad comparison, but inadequate as a stand-alone analytical tool for modern ecosystem science.
Trophic Spectra as a More Faithful Alternative
Because of these shortcomings, ecologists increasingly use trophic spectra — continuous distributions of biomass or abundance across body size or trophic position — rather than discrete pyramids. A trophic spectrum plots the abundance of organisms against their trophic position or body mass, revealing a smooth decline rather than a stepped pyramid. This approach accommodates omnivory, captures the continuous nature of feeding relationships, and allows quantitative comparison across systems. It represents a genuine advance over the pyramid, which remains valuable chiefly as a pedagogical device and a first-order approximation.
The spectrum concept also resolves the apparent contradictions between pyramid types. When abundance is plotted continuously against body size, the patterns that appear as inversions in discrete pyramids emerge as predictable consequences of metabolic scaling. Smaller organisms are typically more abundant and turn over faster, which is exactly why phytoplankton outnumber and outproduce their consumers despite holding less standing biomass. The pyramid, in other words, is a discretised snapshot of a continuous spectrum, and recognising this helps students move from rote memorisation of shapes to genuine mechanistic understanding.
Common Mistakes and Examination Traps
Certain errors recur so frequently in student work that they deserve explicit treatment. The most common is confusing biomass with energy, treating an inverted biomass pyramid as evidence that energy pyramids can also invert. They cannot, and the distinction between stock and flow resolves the confusion. A second frequent error is assuming that the pyramid of number is always upright; the single-tree example demonstrates otherwise. A third is forgetting that trophic level is a functional category, not a species label, leading students to assign a sparrow to a single level when it occupies two.
Diagnosing and Correcting Errors
Another trap involves the ten per cent law, which students often apply as an exact constant rather than an approximation. Real transfer efficiencies vary between roughly five and twenty per cent, and the law describes a central tendency rather than a fixed rule. A related mistake is ignoring the distinction between gross and net primary productivity when constructing energy pyramids; the base of the pyramid should reflect the energy actually available to herbivores, which is net primary production, not the total solar energy intercepted. Confusing these quantities inflates the base and distorts every subsequent calculation.
Finally, students frequently overlook the exclusion of decomposers from standard pyramids. When asked to describe energy flow, they may omit the detritus pathway entirely, forgetting that dead biomass becomes an energy source for decomposers and that this pathway can carry a substantial fraction of total ecosystem energy. A complete answer acknowledges that pyramids describe the grazing pathway primarily and that the detrital pathway runs in parallel, often invisibly. Recognising what the diagram leaves out is as important as reading what it shows.
From Pyramids to Quantitative Ecosystem Analysis
Pyramids are a starting point, not a terminus. Once the basic shapes are understood, the analysis can be extended quantitatively. Ecologists compute ecological efficiency as the ratio of energy assimilated at one level to that at the level below, and they track how this ratio varies with body size, diet, and environmental conditions. Such calculations reveal that the simple ten per cent rule conceals considerable variation, and that systems with high efficiency can support more trophic levels than systems with low efficiency. The pyramid becomes a scaffold for numerical reasoning rather than a static diagram to be memorised.
Computing Efficiencies and Turnover
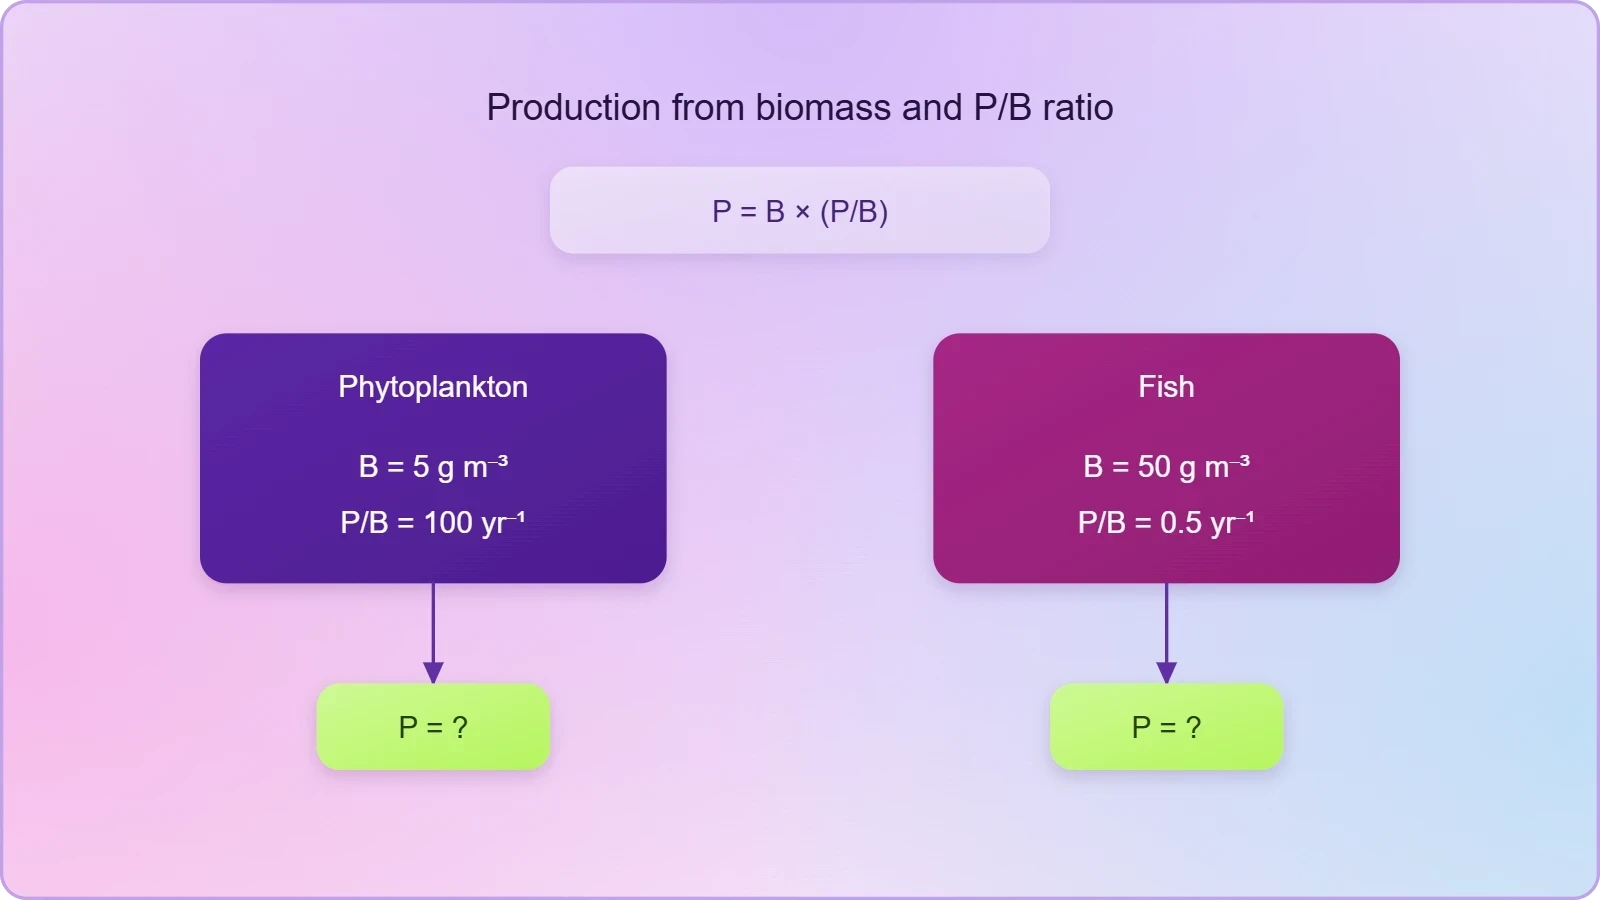
Turnover rate is the ratio of production to standing biomass, and it is the key to interpreting inverted biomass pyramids. For phytoplankton, production may equal or exceed standing biomass over a few days, giving a turnover rate far above one per year. For fish, production is a small fraction of standing biomass, giving a turnover rate well below one. The product of turnover rate and biomass gives production, and it is production — not biomass — that must decline at higher trophic levels. This relationship explains why a small phytoplankton stock can feed a large fish stock without violating any energetic principle.
Here ##P## is production, ##B## is standing biomass, and ##P/B## is the turnover ratio. A phytoplankton community with ##B = 5\ \text{g m}^{-3}## and ##P/B = 100\ \text{yr}^{-1}## produces ##500\ \text{g m}^{-3}\text{yr}^{-1}##, while a fish community with ##B = 50\ \text{g m}^{-3}## and ##P/B = 0.5\ \text{yr}^{-1}## produces only ##25\ \text{g m}^{-3}\text{yr}^{-1}##. The fish hold ten times the biomass but produce one-twentieth the annual production. The energy pyramid, built on production, remains upright; the biomass pyramid, built on standing stock, inverts. The arithmetic resolves the paradox completely.
Preparing for Nutrient Cycling
This analysis of pyramids sets the stage for the next lesson on nutrient cycling, because the two topics are intimately linked. Energy flows through ecosystems unidirectionally and is eventually lost as heat, but nutrients cycle repeatedly between biotic and abiotic reservoirs. The decomposers excluded from standard pyramids are precisely the agents that drive this cycling, converting detritus into inorganic nutrients that producers can reuse. Understanding why pyramids omit saprophytes therefore prepares the ground for understanding why nutrient cycles are closed loops while energy flow is an open path.
The contrast is instructive. An energy pyramid describes a one-way cascade with inevitable losses at each step; a nutrient cycle describes a circuit in which the same atoms are reused indefinitely. Gaseous cycles such as carbon have their reservoir in the atmosphere or hydrosphere, while sedimentary cycles such as phosphorus have theirs in the Earth's crust. The detrital pathway that pyramids neglect is the bridge between the two, returning nutrients to producers and closing the loop. Students who grasp this connection will find the transition to nutrient cycling natural rather than abrupt.
Reading Pyramids Critically in Field and Classroom
The mature ecological habit is to read a pyramid critically, asking what it measures, what it omits, and what assumptions it embeds. A pyramid of number tells you about counting conventions and body-size distributions; a pyramid of biomass tells you about standing stock and turnover; a pyramid of energy tells you about thermodynamic flux. None is universally superior, but the energy pyramid is the most robust because it is anchored in physical law. When comparing ecosystems, ecologists prefer energy-based measures precisely because they are immune to the sampling artefacts that plague the other two.
Practical Guidance for Students
When constructing a pyramid for an examination or a field report, begin by defining the trophic levels explicitly and stating which organisms are included. Measure biomass as dry weight wherever possible, and note the sampling period, because seasonal variation can reverse apparent shapes. If an inversion appears, do not assume an error; investigate turnover rates and body-size distributions before concluding that the data are wrong. Finally, always mention the limitations — multiple trophic levels per species, food webs rather than chains, and the exclusion of saprophytes — because examiners reward awareness of what the model cannot do.
A useful discipline is to sketch all three pyramids for the same system and compare them. In a grassland, all three will be upright and mutually consistent. In a forest, the number pyramid will invert at the base while the others remain upright. In the open ocean, the biomass pyramid will invert while the energy pyramid stays upright. Working through these three cases builds the intuition that pyramid shapes are contingent on what is measured, and that the underlying energetic reality is invariant. This comparative habit transforms pyramids from diagrams to be memorised into instruments to be used.
Beyond the Syllabus: Modern Extensions
Contemporary ecology extends the pyramid concept in several directions. Trophic spectra, as noted, replace discrete levels with continuous distributions. Ecological network analysis models energy flow through food webs as a system of flows and stocks, allowing computation of indirect effects and system-level properties such as ascendency. Stable isotope analysis permits empirical estimation of trophic position for individual organisms, revealing the omnivory that pyramids conceal. These methods do not invalidate the pyramid; they refine it, showing that its simplicity is both its pedagogical strength and its analytical limitation.
For learners progressing to advanced study, the key insight is that the pyramid is a model, and all models simplify. Its value lies in making the consequences of energy loss visible and intuitive. Once that intuition is secure, the student can move confidently to the quantitative tools that modern ecosystem science employs. The next lesson on nutrient cycling will build on this foundation, showing how the materials that organisms are made of, unlike the energy they use, are conserved and recycled through the ecosystem's interconnected compartments.
Also Read
- No links available.
From our network :
- 10 Physics Numerical Problems with Solutions for IIT JEEPrepare for IIT JEE with 10 physics numerical problems, complete with detailed solutions and conceptual explanations. Ideal for mastering kinematics, thermodynamics, electromagnetism, and optics.
- Trump Political Strategy How Geopolitical Stunts Serve As Media Diversions
- Do You Need a New Router or Is Your Internet Plan the Problem?A practical comparison of the signs that point to router limits versus signs your broadband speed or provider is the bottleneck, so you can decide what to replace before spending money.
- EV 2.0: The Solid-State Battery Breakthrough and Global Factory ExpansionDiscover the impact of the Solid-State Battery Breakthrough on the EV market. Learn about CATL and BYD stock growth, global factory expansion in Europe, and the future of EV 2.0 technology.
- Where to Put Your Wireless Router for Better CoverageA practical, physics-grounded guide to router placement: why the centre of the home beats the corner, how walls and metal sap signal, and how to run a simple survey that proves the improvement.
- Analyzing Trump Deportation Numbers Insights Into The 2026 Immigration Crackdown
- How to Print Cheaply: Cutting the Cost per PageA practical, measured guide to lowering what each printed page costs — duplex and draft modes, third-party ink, yield mathematics, and knowing when a new printer beats refills.
- AI-Powered 'Precision Diagnostic' Replaces Standard GRE Score ReportsDiscover the new GRE Precision Diagnostic. Learn how AI-powered behavioral analytics and time-to-solve tracking are replacing standard GRE score reports to empower students.
- 98% of Global MBA Programs Now Prefer GRE Over GMAT Focus EditionExplore why 98% of global MBA programs now prefer the GRE over GMAT Focus. Learn about the shorter GRE format, verbal logic importance, and strategic versatility for students.
RESOURCES
- Resources will be updated soon.