An ecosystem is best understood as nature's functional unit: a bounded working arrangement in which living organisms interact among themselves and with the surrounding physical environment, converting solar energy into organic matter and recycling the raw materials of life. This lesson opens a ten-part course on ecological structure and dynamics by establishing that foundational idea with precision. It examines how ecosystems are classified, how their physical and biological architecture is organised, and how four core processes — productivity, decomposition, energy flow and nutrient cycling — operate together as an integrated system. The pond serves throughout as a compact, self-sustaining model that renders these abstract interactions visible.
What distinguishes a genuinely ecological perspective from a merely descriptive one is the insistence on integration. A list of species and a measurement of temperature tell us very little on their own; the ecosystem concept asks how those components function as a unit, how energy enters and leaves, and how matter circulates internally. That shift from inventory to function is the intellectual heart of this lesson, and it prepares the ground for the quantitative treatment of primary and secondary production that follows in the next session. Learners at intermediate and advanced level will find both the classical definitions and the extensions that modern ecology has added to them.

Because ecosystems vary enormously in scale — from a droplet of pond water to the entire biosphere — the lesson also addresses boundaries, hierarchy and the awkward but unavoidable question of where one system ends and another begins. It introduces keystone species and ecosystem engineers, whose influence far exceeds their abundance, and it extends the classical terrestrial–aquatic division to include the human-made systems in which most learners actually live. By the close, the reader should be able to describe any ecosystem in terms of structure, function and scale, and to reason about why its productivity and stability depend on processes operating far beyond its visible inhabitants.
On This Page
- The Ecosystem Concept: Functional Units and the Problem of Boundaries
- Structure of the Ecosystem: Composition and Stratification
- The Four Functional Aspects That Make an Ecosystem a Unit
- The Pond as a Model Ecosystem
- Keystone Species, Ecosystem Engineers and the Control of Structure
- Decomposition, Climate and the Balance of the System
- Global Productivity, Ecosystem Services and the Road Ahead
- Quantitative Foundations: Modelling Energy and Matter in Ecosystems
The Ecosystem Concept: Functional Units and the Problem of Boundaries
An ecosystem can be visualised as a functional unit of nature, where living organisms interact among themselves and also with the surrounding physical environment. The definition is deliberately functional rather than merely spatial: what makes a pond or a forest an ecosystem is not a fence or a shoreline but the existence of sustained interaction — energy capture, transfer, transformation and loss — among its components. This is why ecologists speak of the ecosystem as the basic unit of ecological study, the smallest arrangement in which the full circulation of energy and matter can be observed and analysed as a coherent whole.
Ecosystems vary greatly in size, from a small pond to a large forest or a sea. Many ecologists regard the entire biosphere as a global ecosystem, a composite of all local ecosystems on Earth. Because this global system is far too large and complex to be studied at one time, it is convenient to divide it into two basic categories, namely terrestrial and aquatic. Forest, grassland and desert exemplify terrestrial ecosystems; pond, lake, wetland, river and estuary exemplify aquatic ones. Crop fields and an aquarium may also be considered man-made ecosystems, a category we will expand considerably below.
Scale, Hierarchy and the Continuum from Microcosm to Biosphere
The scale continuum deserves explicit attention because it governs how ecologists design studies. At the smallest end sit microcosms — a flask of pond water, a decaying log, a patch of leaf litter — which permit controlled experiment and rapid replication. Above them lie mesocosms such as a whole pond or a field plot, then landscapes and biomes, and finally the biosphere itself. Each level has emergent properties not predictable from the level beneath it, which is precisely why the hierarchy exists. A single leaf's photosynthesis cannot tell you the productivity of a forest, and a forest's productivity cannot be summed naively to yield the biosphere's.
Boundaries are a practical necessity rather than a natural fact. A pond has a visible edge, but nutrients and organisms cross it freely; a forest edge is a gradient, not a line. Ecologists therefore define boundaries operationally, according to the question being asked, and they distinguish closed systems, which exchange neither matter nor energy, from open systems, which exchange both. Real ecosystems are emphatically open. Recognising this prevents a common error: treating a study plot as if it were sealed, and thereby missing the subsidies and exports that may dominate its budget.
Natural, Man-Made and Hybrid Systems
Beyond crop fields and aquaria, two further categories of human-made ecosystem merit attention. Agroecosystems are deliberately simplified, high-yield systems sustained by external inputs of seed, fertiliser, pesticide, irrigation and fossil energy; their productivity is impressive but their self-regulation is weak, making them dependent on continuous management. Urban ecosystems are stranger still, dominated by heterotrophic consumption, engineered water and waste flows, and heat islands, yet containing genuine ecological communities in parks, gardens, rooftops and soils. Both are legitimate ecosystems in the functional sense, and both repay study because they reveal how much of an ecosystem's behaviour depends on its inputs.
The dependence of man-made systems on human subsidy is the key analytical point. A natural grassland balances its own nutrient budget through decomposition and cycling; a wheat field exports most of its production at harvest and must be replenished artificially. This contrast illuminates the four functional aspects introduced below, because it shows what happens when one of them — nutrient cycling — is deliberately interrupted. Hybrid systems, such as a reservoir or a restored wetland, sit between the categories and are increasingly the focus of applied ecology and conservation planning.
Structure of the Ecosystem: Composition and Stratification
Interaction of biotic and abiotic components results in a physical structure that is characteristic for each type of ecosystem. Identification and enumeration of plant and animal species of an ecosystem gives its species composition, the inventory of what lives there. Vertical distribution of different species occupying different levels is called stratification. In a forest, trees occupy the top vertical strata or layer, shrubs the second, and herbs and grasses occupy the bottom layers. Structure, in short, is the spatial and taxonomic architecture within which function occurs, and it is the first thing an ecologist records when entering an unfamiliar system.
The structural description has two dimensions that are often conflated. Species composition answers the question of identity and richness; stratification answers the question of arrangement. Two forests may share almost identical species lists yet differ profoundly in structure if one is even-aged and closed while the other is layered and open. Because stratification determines how light, wind and moisture are distributed through the canopy, it directly governs productivity and microclimate. Structure is therefore not decorative detail but a determinant of function, and changes in structure — through logging, grazing or invasion — propagate rapidly into the processes described later.
Abiotic and Biotic Components in Detail
The abiotic component comprises the physical and chemical environment: water with its dissolved inorganic and organic substances, the soil or sediment, solar radiation, temperature, and the cycles of day-length and climate. These factors regulate the rate of function of the entire system, setting the ceiling on what the biota can achieve. The biotic component divides into autotrophs, the producers that fix radiant energy; heterotrophs, the consumers that feed on them; and decomposers, the fungi, bacteria and flagellates that return matter to inorganic form. Each category has a distinct functional role, and the ecosystem's integrity depends on all three operating in balance.
Producers are the gateway through which energy enters the biological realm, and their photosynthetic capacity varies enormously between species and environments. Consumers are conventionally divided into primary consumers or herbivores, secondary and tertiary consumers or carnivores, and parasites, with omnivores cutting across the categories. Decomposers, though least conspicuous, are indispensable: without them, dead matter would accumulate and nutrients would remain locked in unavailable form. A useful discipline for learners is to assign every organism encountered to one of these functional groups, because that exercise reveals the trophic skeleton of the system far more clearly than a taxonomic list alone.
Stratification in Forests and the Vertical Zonation of Lakes
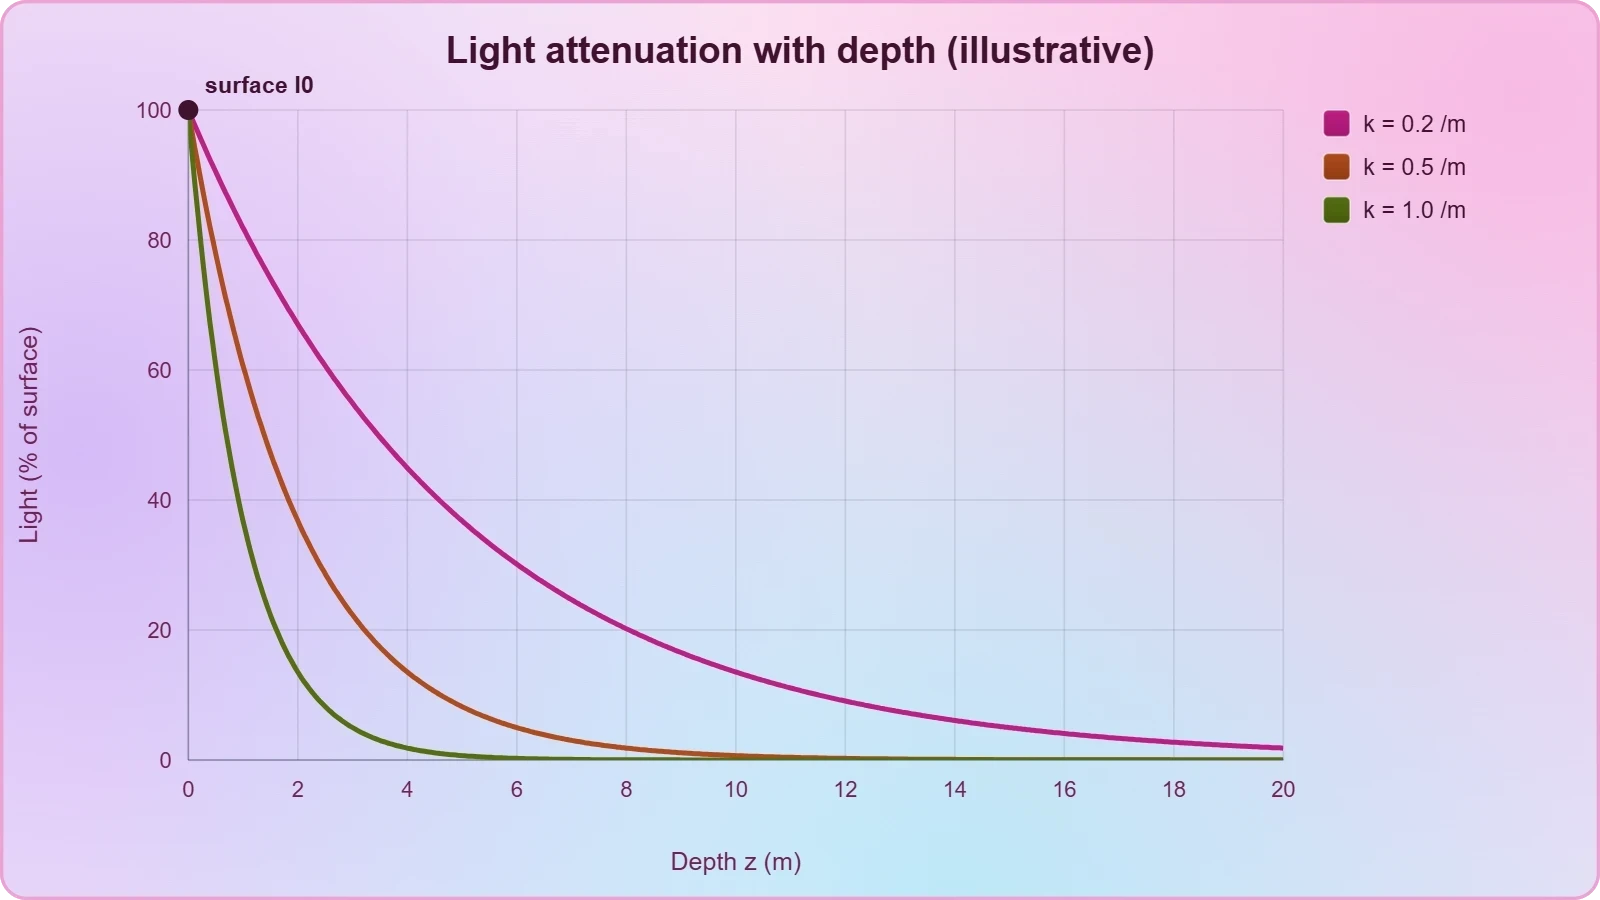
Stratification is most familiar in forests, but it is equally real in water. A lake displays vertical zonation into a littoral zone of rooted and floating plants at the margins, a limnetic zone of open water where phytoplankton dominate, a profundal zone of deep, dark water below the reach of effective light, and a benthic zone of sediment at the bottom. Light attenuation with depth is the controlling variable, and it can be described by the Beer–Lambert relationship, where intensity falls exponentially with depth:
Here ##I_0## is surface irradiance, ##k## the attenuation coefficient and ##z## depth. Because photosynthesis requires light above a compensation point, this exponential decay defines the euphotic depth and therefore the volume of the lake in which primary production can occur. Thermal stratification reinforces the pattern in summer, when a warm epilimnion floats above a cold hypolimnion and a sharply graded metalimnion, suppressing vertical mixing and isolating deep water from atmospheric oxygen. Recognising these layers explains why deep lake water can become anoxic while the surface teems with life.
The Four Functional Aspects That Make an Ecosystem a Unit
The components of the ecosystem are seen to function as a unit when we consider four aspects: productivity, decomposition, energy flow and nutrient cycling. Productivity is the capture of energy and synthesis of organic matter; decomposition is the breakdown of dead matter into inorganic substances; energy flow is the unidirectional transfer of that captured energy through trophic levels, with dissipation as heat; and nutrient cycling is the return and reuse of mineral elements. Together these four processes constitute the metabolic life of the ecosystem, and no single one can be understood in isolation from the others.
It is worth being explicit about scope. Productivity and decomposition receive detailed quantitative treatment in the lessons that follow, and nutrient cycling is developed in a later session of this course. The present lesson establishes their definitions, their interdependence and their place in the overall scheme, so that the later treatments have somewhere to attach. The essential point for now is that the four aspects form a closed logical loop: energy captured by productivity passes through consumers, is released from dead matter by decomposition, and the nutrients so liberated sustain the next round of productivity.
Productivity and Decomposition: The Input and the Return
Primary production is defined as the amount of biomass or organic matter produced per unit area over a time period by plants during photosynthesis, expressed in terms of weight (g m⁻²) or energy (kcal m⁻²). The rate of biomass production is called productivity, expressed as g m⁻² yr⁻¹ or (kcal m⁻²) yr⁻¹ to permit comparison between ecosystems. Gross primary productivity (GPP) is the rate of production of organic matter during photosynthesis; a considerable amount of GPP is used by plants in respiration (R). Gross primary productivity minus respiration losses is net primary productivity (NPP), the biomass available to heterotrophs.
Decomposition is the complementary process. Dead plant remains such as leaves, bark and flowers, and dead remains of animals including fecal matter, constitute detritus, the raw material for decomposition. Decomposers break complex organic matter into inorganic substances like carbon dioxide, water and nutrients. The important steps are fragmentation, leaching, catabolism, humification and mineralisation, and they operate simultaneously rather than in strict sequence. Detritivores such as the earthworm fragment detritus into smaller particles; leaching carries water-soluble inorganic nutrients down the soil horizon where they precipitate as unavailable salts; bacterial and fungal enzymes then degrade detritus into simpler inorganic substances by catabolism.
Energy Flow and Nutrient Cycling: Transfer and Reuse
Energy flow is unidirectional. Solar energy is captured by autotrophs, transferred to heterotrophs through consumption, and progressively dissipated and lost as heat to the environment at every step. Matter, by contrast, circulates. The mineral nutrients released by decomposition are taken up again by producers, so the same atoms may pass through many generations of organisms. This asymmetry — energy flowing through, matter cycling within — is the single most important structural principle in ecology, and it explains why ecosystems require a continuous solar input while their material requirements can in principle be met internally.
The efficiency of transfer between trophic levels is modest, typically around ten per cent, which is why food chains are short and why biomass pyramids usually taper. Nutrient cycling, by contrast, can approach high efficiency in undisturbed systems, though losses through leaching and export always occur and must be balanced by inputs from weathering, fixation or deposition. The next lesson develops primary and secondary production quantitatively; for now, hold the relationship in mind as a budget in which energy is a throughput and nutrients are a stock.
The Pond as a Model Ecosystem
To understand the ethos of an aquatic ecosystem, take a small pond as an example. It is a fairly self-sustainable unit and a rather simple example that nevertheless explains even the complex interactions existing in an aquatic ecosystem. A pond is a shallow water body in which all four basic components of an ecosystem are well exhibited. The abiotic component is the water with all the dissolved inorganic and organic substances and the rich soil deposit at the bottom. The solar input, the cycle of temperature, day-length and other climatic conditions regulate the rate of function of the entire pond.
The autotrophic components include the phytoplankton, some algae and the floating, submerged and marginal plants found at the edges. The consumers are represented by the zooplankton and the free-swimming and bottom-dwelling forms. The decomposers are the fungi, bacteria and flagellates, especially abundant at the bottom of the pond. This system performs all the functions of any ecosystem and of the biosphere as a whole: conversion of inorganic into organic material with the help of the radiant energy of the sun by the autotrophs; consumption of the autotrophs by heterotrophs; and decomposition and mineralisation of the dead matter to release nutrients for reuse by the autotrophs.
Why the Pond Works as a Teaching Model
The pond's pedagogical value lies in its completeness and its compactness. Every functional group is present and observable within a few square metres, the boundaries are reasonably clear, and the whole system can be sampled with simple equipment. Because it is shallow, light penetrates to the sediment over much of its area, so benthic and pelagic processes are closely coupled. Because it is small, perturbations such as nutrient enrichment produce visible responses within weeks rather than decades, making it an ideal subject for the kind of quantitative reasoning that later lessons will demand.
Its limitations should also be acknowledged. A pond is not a miniature ocean: the ratio of sediment surface to water volume is far higher, mixing regimes differ, and the food web is simpler. Nor is it closed; it receives leaf litter, runoff and groundwater, and loses water by evaporation and seepage. These caveats matter because a recurring error in ecology is to generalise from a convenient model to all systems of a nominal class. The pond teaches principles faithfully, but the magnitudes must always be checked against the system actually under study.
Reading the Pond as a System of Cycles, Chains and Webs
Within the pond, relationships of three kinds are created by the flow of energy: cycles, chains and webs. The nutrient cycle returns elements from sediment and water to the phytoplankton; the food chain traces a single path from producer to top consumer; the food web acknowledges that most consumers are generalists feeding at several levels. These structures are inter-related, and their inter-relationship is what gives the system its resilience. Remove a node and the consequences propagate along every connection, which is why the pond repays careful mapping rather than casual observation.
A practical exercise makes the point. Trace a carbon atom from dissolved bicarbonate into a phytoplankton cell, into a grazing zooplankton, into a small fish, back into the water as respiratory carbon dioxide, and finally into a submerged macrophyte. The same atom may complete this circuit many times in a season. Trace instead a unit of energy captured in that same phytoplankton cell, and it can make the journey only once, degrading at each transfer until it is entirely dispersed as heat. The contrast between the two journeys is the lesson.

Keystone Species, Ecosystem Engineers and the Control of Structure
Structure is not simply the passive outcome of climate and soil; it is actively maintained by particular organisms. A keystone species is one whose influence on community structure is disproportionately large relative to its abundance. The classic illustration is the sea otter, which preys on sea urchins; where otters are removed, urchins multiply and graze kelp forests to barren ground, collapsing the entire associated community. Keystone effects are not confined to predators. Certain plants, pollinators and pathogens can play equivalent roles, and identifying them is a central task of conservation biology.
Ecosystem engineers are a related but distinct category: organisms that physically modify, maintain or create habitat, thereby changing the availability of resources to other species. Beavers build dams and convert streams to wetlands; earthworms, the farmer's friend, loosen soil and accelerate the breakdown of organic matter; corals accrete the reef framework itself; and termites rework soils and sediments. Engineers may or may not be keystones, and keystones may or may not engineer, but both concepts sharpen the same insight: some species control structure far out of proportion to their numbers.
Distinguishing Keystones, Dominants and Engineers
Clarity here prevents a common confusion. A dominant species is simply the most abundant, and abundance alone confers influence without implying a keystone role. A keystone is defined by the ratio of its effect to its biomass, so a rare predator can be keystone while a common grass is merely dominant. An engineer is defined by the mechanism of its effect — physical modification of habitat — rather than by the magnitude. The three categories can overlap, and a single species may be all three, but the analytical questions they pose are different and should be kept separate.
For the pond, consider the consequences of removing each functional group in turn. Remove the phytoplankton and the system loses its energy base within days. Remove the zooplankton and algal blooms may follow, with cascading effects on light and oxygen. Remove the decomposers and sediment accumulates while nutrients remain locked in detritus. Each removal tests a different hypothesis about control, and the results demonstrate that structure is maintained by a network of interactions rather than by any single master variable.
Decomposition, Climate and the Balance of the System
Decomposition is largely an oxygen-requiring process, and its rate is controlled by the chemical composition of detritus and by climatic factors. Under a given climate, decomposition is slower if detritus is rich in lignin and chitin, and quicker if it is rich in nitrogen and water-soluble substances such as sugars. Temperature and soil moisture are the most important climatic factors regulating decomposition through their effects on the activities of soil microbes. Warm and moist environments favour decomposition, whereas low temperature and anaerobiosis inhibit it, resulting in the build-up of organic materials.
Humification leads to the accumulation of a dark-coloured amorphous substance called humus, which is highly resistant to microbial action and decomposes at an extremely slow rate. Being colloidal in nature, it serves as a reservoir of nutrients. Humus is further degraded by some microbes, and the release of inorganic nutrients occurs by mineralisation. This two-stage arrangement — rapid turnover of labile material, slow turnover of recalcitrant material — is what gives soils their capacity to buffer nutrient supply, and it explains why organic matter accumulates in cold or waterlogged conditions.
Worked Example: A Simple Decomposition Budget
Suppose a forest floor receives 600 g m⁻² yr⁻¹ of leaf litter, of which 70 per cent is labile and 30 per cent is lignin-rich. If the labile fraction decomposes at 0.8 yr⁻¹ and the recalcitrant fraction at 0.05 yr⁻¹, the annual mass loss is ##(0.7 \times 600 \times 0.8) + (0.3 \times 600 \times 0.05) = 336 + 9 = 345## g m⁻² yr⁻¹. The remaining 255 g m⁻² accumulates as litter and humus. This simple calculation demonstrates why organic matter builds up even in productive forests: the slow fraction dominates the standing stock.

The same arithmetic can be expressed as a first-order decay model, which is the standard quantitative description of litter breakdown:
Here ##M_0## is initial litter mass, ##M_t## the mass remaining after time ##t##, and ##k## the decay constant. The half-life of the material is ##\ln 2 / k##, so a ##k## of 0.05 yr⁻¹ corresponds to a half-life of roughly fourteen years, while a ##k## of 0.8 yr⁻¹ gives a half-life of under a year. Learners should note that ##k## is not a universal constant but a property of both the substrate and the environment, which is precisely why the same leaf species decays at very different rates in a tropical and a boreal forest.
Common Mistakes and How to Avoid Them
Several errors recur in student work on this material. The first is confusing productivity with standing biomass: a mature forest has enormous biomass but modest net productivity, while a fertilised pond may have small biomass and high productivity. The second is treating decomposition as a single step rather than five simultaneous processes. The third is assuming that energy and nutrients behave alike; energy flows and is lost, nutrients cycle and are conserved. The fourth is forgetting that all four functional aspects operate concurrently, so that a change in one is felt immediately in the others.
A fifth error concerns units. Productivity must be expressed per unit area per unit time, and comparisons between ecosystems are meaningless unless the time base and the basis (dry weight or energy) are stated. A sixth is the assumption that a self-sustaining system is a closed one; the pond is self-sustaining in the sense that it maintains its functions without human intervention, not in the sense that it exchanges nothing with its surroundings. Attending to these distinctions early makes the quantitative lessons that follow far easier to absorb.
Global Productivity, Ecosystem Services and the Road Ahead
Primary productivity depends on the plant species inhabiting a particular area. It also depends on a variety of environmental factors, the availability of nutrients and the photosynthetic capacity of plants, and therefore varies in different types of ecosystems. The annual net primary productivity of the whole biosphere is approximately 170 billion tons (dry weight) of organic matter. Of this, despite occupying about 70 per cent of the surface, the productivity of the oceans is only 55 billion tons. The rest, of course, is on land. The reason for the low productivity of the ocean is a question worth discussing with a teacher.
The explanation lies chiefly in the availability of light and nutrients in the open ocean. Light penetrates only the upper euphotic layer, and the vast majority of ocean volume is dark. More importantly, the limiting nutrients — nitrogen, phosphorus and iron — are scarce in surface waters because they are supplied mainly by the slow mixing of deep water and by terrestrial runoff, both of which are restricted far from land. The result is that the open ocean is effectively a desert, while the narrow coastal margins and upwelling zones, rich in nutrients, account for a disproportionate share of marine production.
Ecosystem Services and the Value of Function
The four functional aspects translate directly into services on which human societies depend. Productivity supplies food, fibre and fuel; decomposition maintains soil fertility and disposes of waste; energy flow underpins every food web from which we harvest; and nutrient cycling, when intact, sustains agriculture without external subsidy. Forests regulate water flow and climate, wetlands purify water and buffer floods, and coastal systems nursery fisheries. Recognising these services as the output of functioning ecosystems, rather than as free gifts, is the conceptual bridge between pure ecology and environmental policy.
When a service is degraded, the loss is usually traced to a specific functional failure. Eutrophication is a failure of nutrient cycling in which excess inputs overwhelm the system; soil erosion is a failure of decomposition and structure maintenance; and fishery collapse is a failure of productivity to keep pace with extraction. Framing environmental problems in these terms gives them analytical precision and points toward remedies that address the underlying process rather than its symptoms.
Preparing for the Next Lesson
This lesson has established the ecosystem as a functional unit, classified its types, described its structure and stratification, and introduced the four functional aspects that make it operate as a whole. The pond has served as a complete and tractable model, and the extensions — boundaries, scale, man-made systems, keystone species and engineers — have shown how the classical concept is applied in contemporary ecology. The next lesson takes up productivity in detail, distinguishing primary from secondary production and developing the quantitative treatment that this lesson has only sketched.
Before proceeding, consolidate the essentials. Be able to define an ecosystem, classify it, describe its structure, and name the four functional aspects with their definitions and units. Be able to explain why energy flows while nutrients cycle, and why the pond is a useful but limited model. Be able to distinguish a keystone species from a dominant one and from an ecosystem engineer. With these foundations secure, the quantitative study of production, decomposition and energy transfer becomes a matter of arithmetic rather than of principle.
Quantitative Foundations: Modelling Energy and Matter in Ecosystems
Although the full quantitative treatment belongs to later lessons, a few formal relationships should be introduced now so that the four functional aspects can be handled with precision. The first is the productivity identity already stated: ##NPP = GPP - R##. The second is the trophic transfer efficiency, the ratio of production at one trophic level to production at the level below, which is typically around ten per cent. The third is the mass-balance condition for a nutrient, which states that the change in storage equals inputs minus outputs plus internal transformations. These three relationships underpin almost every calculation in ecosystem ecology.
Consider a simple numerical illustration. A pond's phytoplankton fix 1,200 kcal m⁻² yr⁻¹ gross, of which 400 kcal m⁻² yr⁻¹ is respired, leaving an NPP of 800. If herbivores assimilate ten per cent of that, their production is 80 kcal m⁻² yr⁻¹, and the next level receives 8. The rapid attenuation explains why top predators are scarce and why food chains rarely exceed four or five links. The same arithmetic applied to nutrients, which are recycled rather than lost, yields very different and far more sustainable conclusions.

Implementing a Simple Ecosystem Budget
Programming offers a disciplined way to explore these relationships. The short script below computes net primary productivity, trophic transfers and the resulting biomass at each level, allowing the learner to vary the parameters and observe the consequences. It is deliberately minimal, but it captures the essential logic of an ecosystem energy budget and can be extended to include decomposition and nutrient return.
# Simple ecosystem energy budget
gpp = 1200.0          # gross primary productivity, kcal m^-2 yr^-1
respiration = 400.0   # plant respiration loss
efficiency = 0.10     # trophic transfer efficiency

npp = gpp - respiration
print(f"NPP = {npp:.1f} kcal m^-2 yr^-1")

production = npp
for level in range(1, 5):
    production = production * efficiency
    print(f"Level {level} production = {production:.2f} kcal m^-2 yr^-1")

# Mass balance for a nutrient
inputs, outputs, storage = 12.0, 9.5, 40.0
delta = inputs - outputs
print(f"Change in nutrient storage = {delta:+.1f} kg ha^-1 yr^-1")
print(f"New storage after one year = {storage + delta:.1f} kg ha^-1")
Running this script makes two lessons vivid. First, the geometric decline of production with trophic level is steep, so small changes in efficiency have large consequences at the top. Second, the nutrient budget behaves quite differently: a modest surplus of 2.5 kg ha⁻¹ yr⁻¹ accumulates steadily, and over decades it transforms the system, whereas a deficit would progressively impoverish it. Learners should modify the parameters, including a negative efficiency scenario representing a system subsidised by external inputs, and observe how the outputs change.
Advanced Points and Wider Context
Three refinements deserve mention for advanced learners. First, the ten per cent figure is an average, and real efficiencies range from about five to twenty per cent depending on the organisms and the environment; aquatic systems with ectothermic consumers often transfer energy more efficiently than terrestrial ones with warm-blooded predators. Second, ecosystems are not in equilibrium, and the steady-state assumption implicit in simple budgets must be relaxed when studying succession, disturbance or climate change. Third, the boundaries of the system determine which fluxes count as inputs and outputs, so the same data can yield different budgets under different definitions.
Finally, the ecosystem concept has proved remarkably durable because it is scale-free and function-based. The same four aspects describe a pond, a forest, a city and the biosphere, and the same equations apply with different parameters. That generality is the concept's strength and its invitation: having established the framework in this lesson, the course now turns to the quantitative study of productivity, then decomposition, energy flow and ecological pyramids, and finally to nutrient cycling and the applied questions of conservation and management.
Also Read
- No links available.
From our network :
- EV 2.0: The Solid-State Battery Breakthrough and Global Factory ExpansionDiscover the impact of the Solid-State Battery Breakthrough on the EV market. Learn about CATL and BYD stock growth, global factory expansion in Europe, and the future of EV 2.0 technology.
- AI-Powered 'Precision Diagnostic' Replaces Standard GRE Score ReportsDiscover the new GRE Precision Diagnostic. Learn how AI-powered behavioral analytics and time-to-solve tracking are replacing standard GRE score reports to empower students.
- Where to Put Your Wireless Router for Better CoverageA practical, physics-grounded guide to router placement: why the centre of the home beats the corner, how walls and metal sap signal, and how to run a simple survey that proves the improvement.
- 10 Physics Numerical Problems with Solutions for IIT JEEPrepare for IIT JEE with 10 physics numerical problems, complete with detailed solutions and conceptual explanations. Ideal for mastering kinematics, thermodynamics, electromagnetism, and optics.
- Do You Need a New Router or Is Your Internet Plan the Problem?A practical comparison of the signs that point to router limits versus signs your broadband speed or provider is the bottleneck, so you can decide what to replace before spending money.
- 98% of Global MBA Programs Now Prefer GRE Over GMAT Focus EditionExplore why 98% of global MBA programs now prefer the GRE over GMAT Focus. Learn about the shorter GRE format, verbal logic importance, and strategic versatility for students.
- Analyzing Trump Deportation Numbers Insights Into The 2026 Immigration Crackdown
- Trump Political Strategy How Geopolitical Stunts Serve As Media Diversions
- How to Print Cheaply: Cutting the Cost per PageA practical, measured guide to lowering what each printed page costs — duplex and draft modes, third-party ink, yield mathematics, and knowing when a new printer beats refills.
RESOURCES
- Resources will be updated soon.