Sewage treatment stands as one of the quietest triumphs of applied microbiology, a process so embedded in urban life that most citizens never pause to consider it. Every time a tap runs or a toilet flushes, a vast engineered ecosystem of bacteria, fungi, and protozoa begins working to return that water to the environment in a condition safe enough for rivers and streams. The journey from household wastewater to a dischargeable effluent is not a single act but a carefully sequenced choreography of physical separation and biological digestion, each stage preparing the ground for the next. Understanding this choreography matters because it reveals how deeply human welfare depends on microbial labour that operates silently beneath our streets.
This lesson examines the two foundational stages of that journey: primary treatment, which relies on gravity and screens to strip away solids, and secondary treatment, which hands the remaining dissolved organic load to aerobic microbes cultivated in aerated tanks. Along the way, we will look closely at the composition of raw sewage, the chemistry of floc formation, the role of protozoa as microbial predators within those flocs, and the settling step that produces activated sludge. We will also confront a persistent misconception—that primary treatment disinfects—and extend the discussion into tertiary treatment, nutrient removal, and disinfection, which together complete the modern plant.
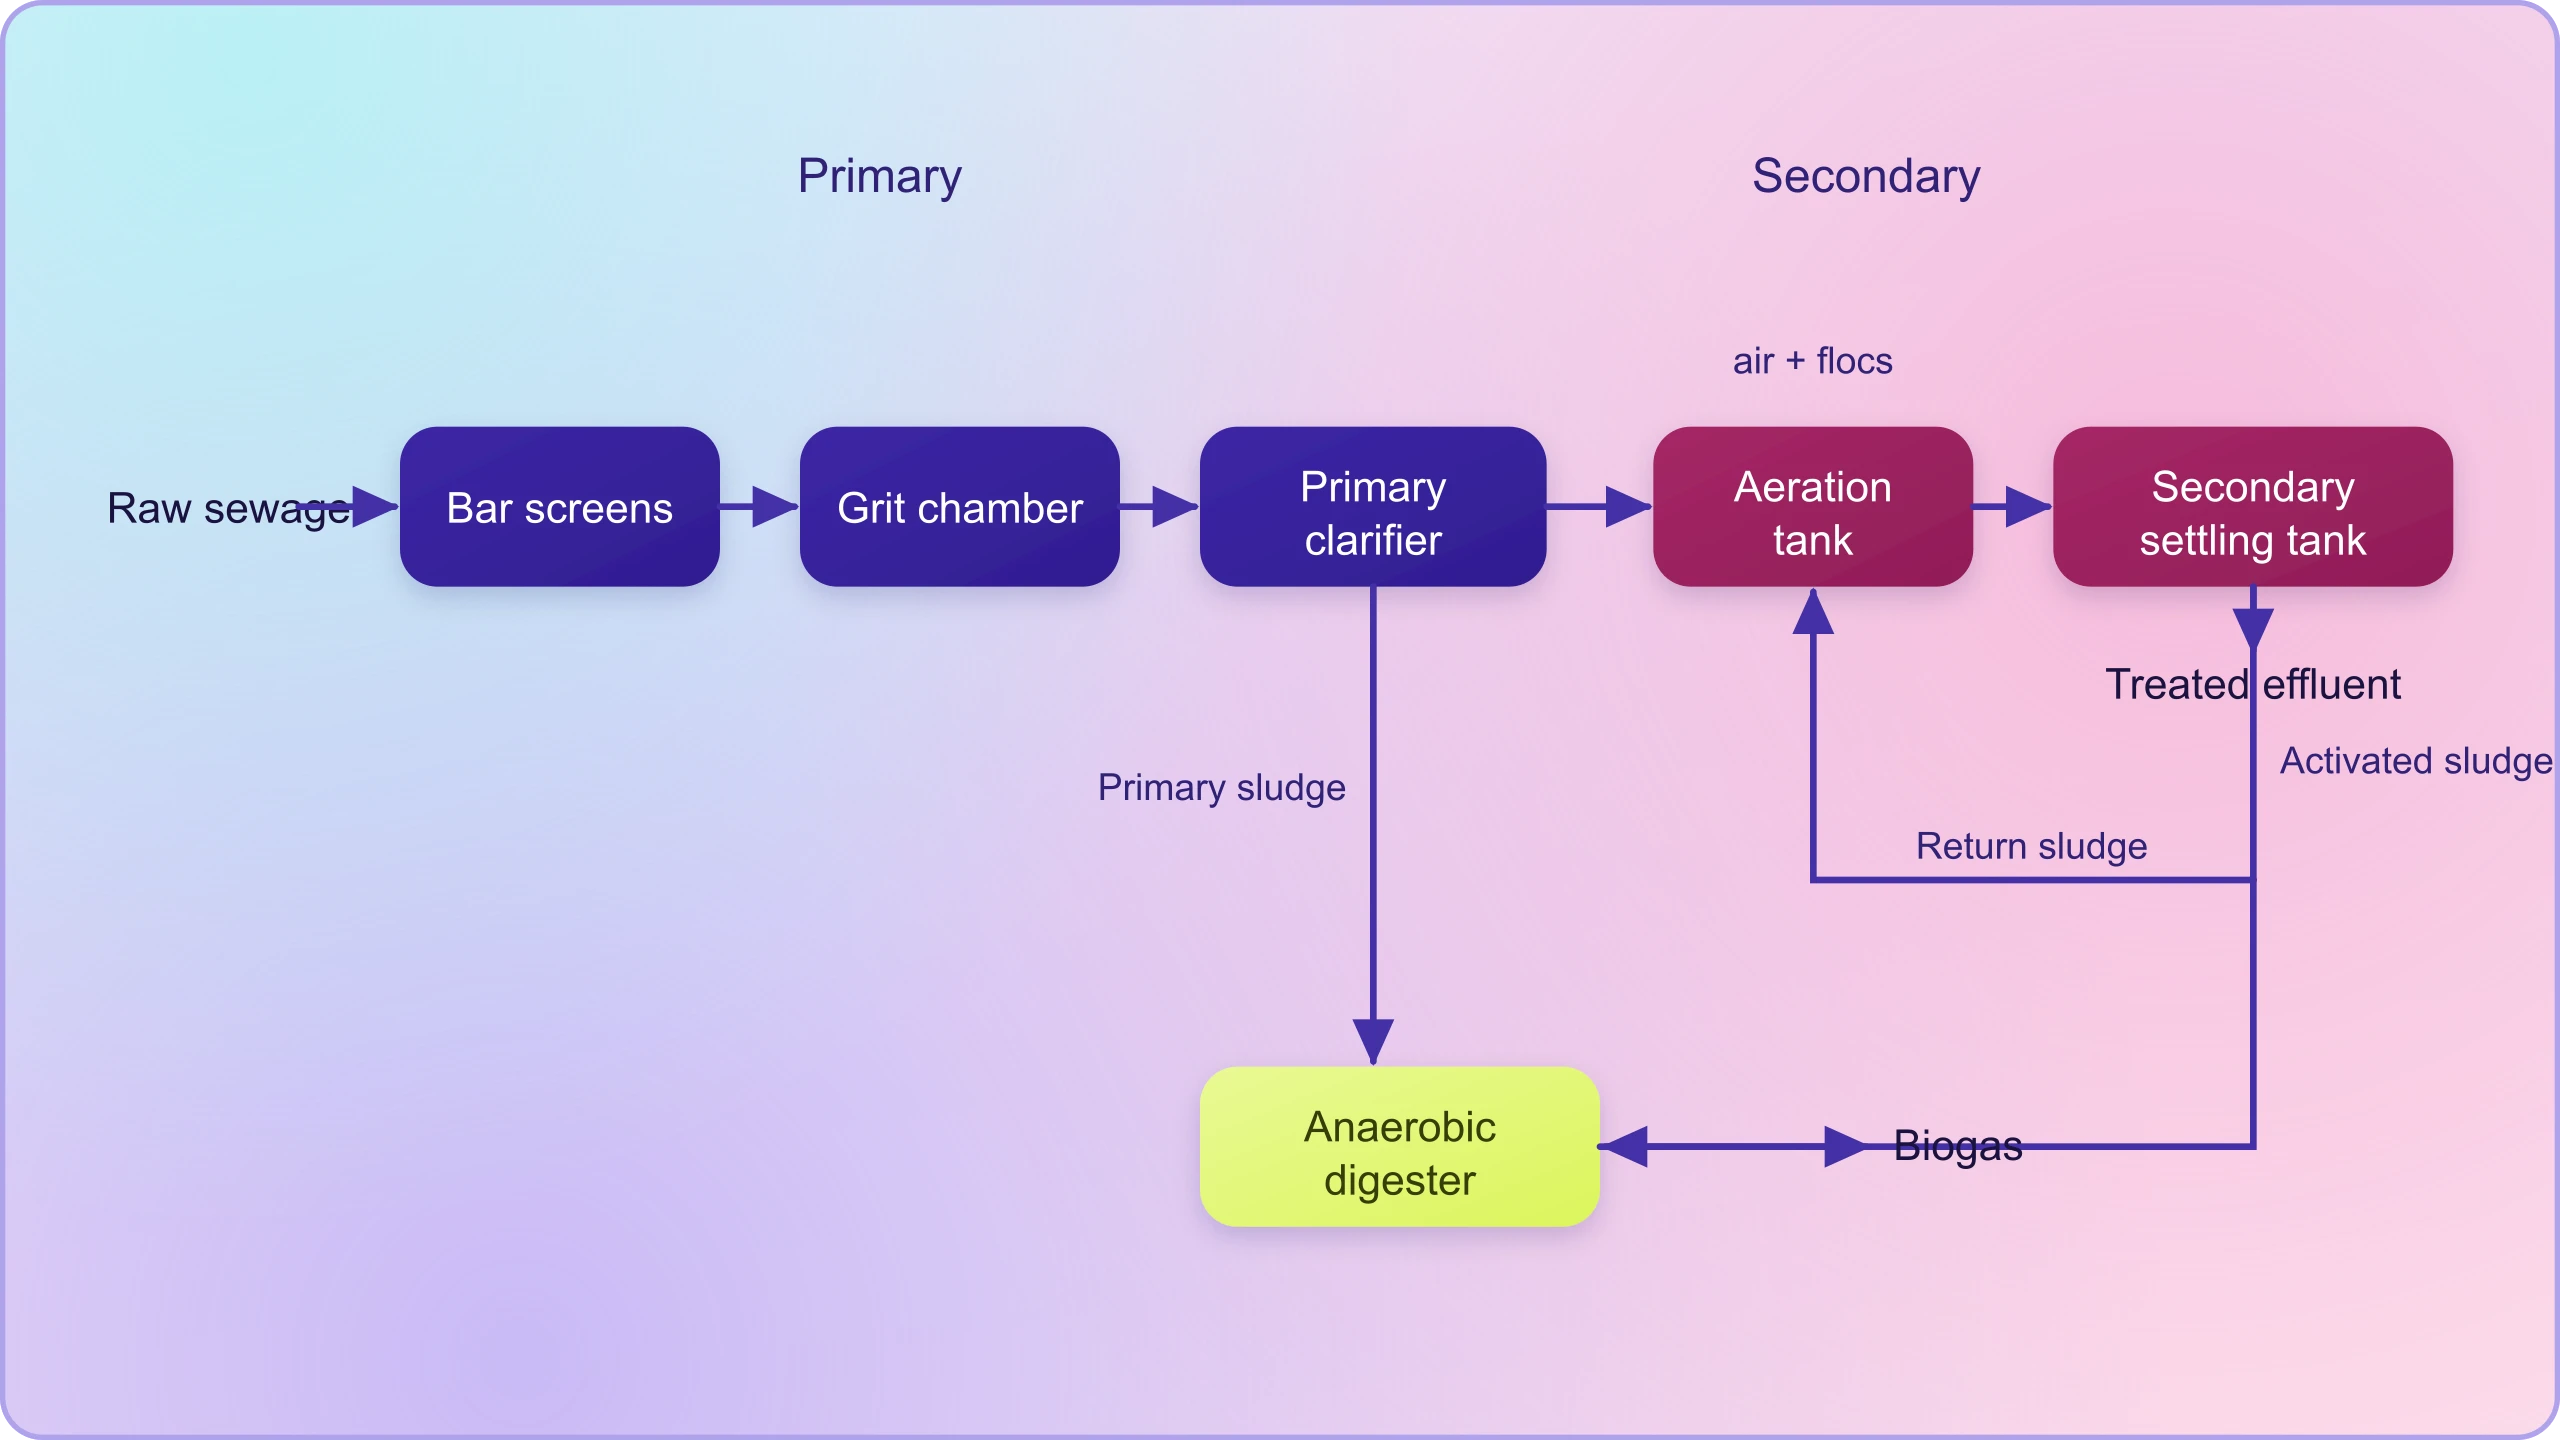
Beyond the engineering, the lesson situates sewage treatment within a wider environmental and civic narrative. Untreated sewage discharged into rivers carries pathogens and oxygen-depleting organic matter, and India's Ganga Action Plan and Yamuna Action Plan were launched precisely to confront that reality by building treatment capacity along two of the subcontinent's most stressed rivers. By the end, you should be able to trace a drop of wastewater through every stage of a plant, explain why biochemical oxygen demand is the metric that governs the process, and recognise why no man-made technology has yet rivalled microbial treatment of sewage.
On This Page
- The Composition of Sewage and Why It Demands Treatment
- Primary Treatment: Physical Removal by Filtration and Sedimentation
- Secondary Treatment: Cultivating Aerobic Microbes in Flocs
- Activated Sludge, Settling, and Anaerobic Digestion
- Tertiary Treatment, Disinfection, and Environmental Impact
- Case Study: The Ganga and Yamuna Action Plans
- Worked Examples and Common Misconceptions
- Preparing for BOD Measurement and the Next Lesson
The Composition of Sewage and Why It Demands Treatment
Raw sewage is far more than dirty water; it is a dilute, chemically complex suspension whose composition determines every design decision in a treatment plant. Roughly 99.9 per cent of domestic sewage is water, but the remaining fraction carries suspended solids, dissolved organic compounds, nutrients such as nitrogen and phosphorus, heavy metals, and an enormous microbial load including faecal pathogens. The organic fraction—proteins, carbohydrates, fats, and urea—is the primary target of biological treatment because bacteria oxidise it while consuming dissolved oxygen from the receiving water. Understanding this composition explains why treatment proceeds in stages rather than in a single vessel.
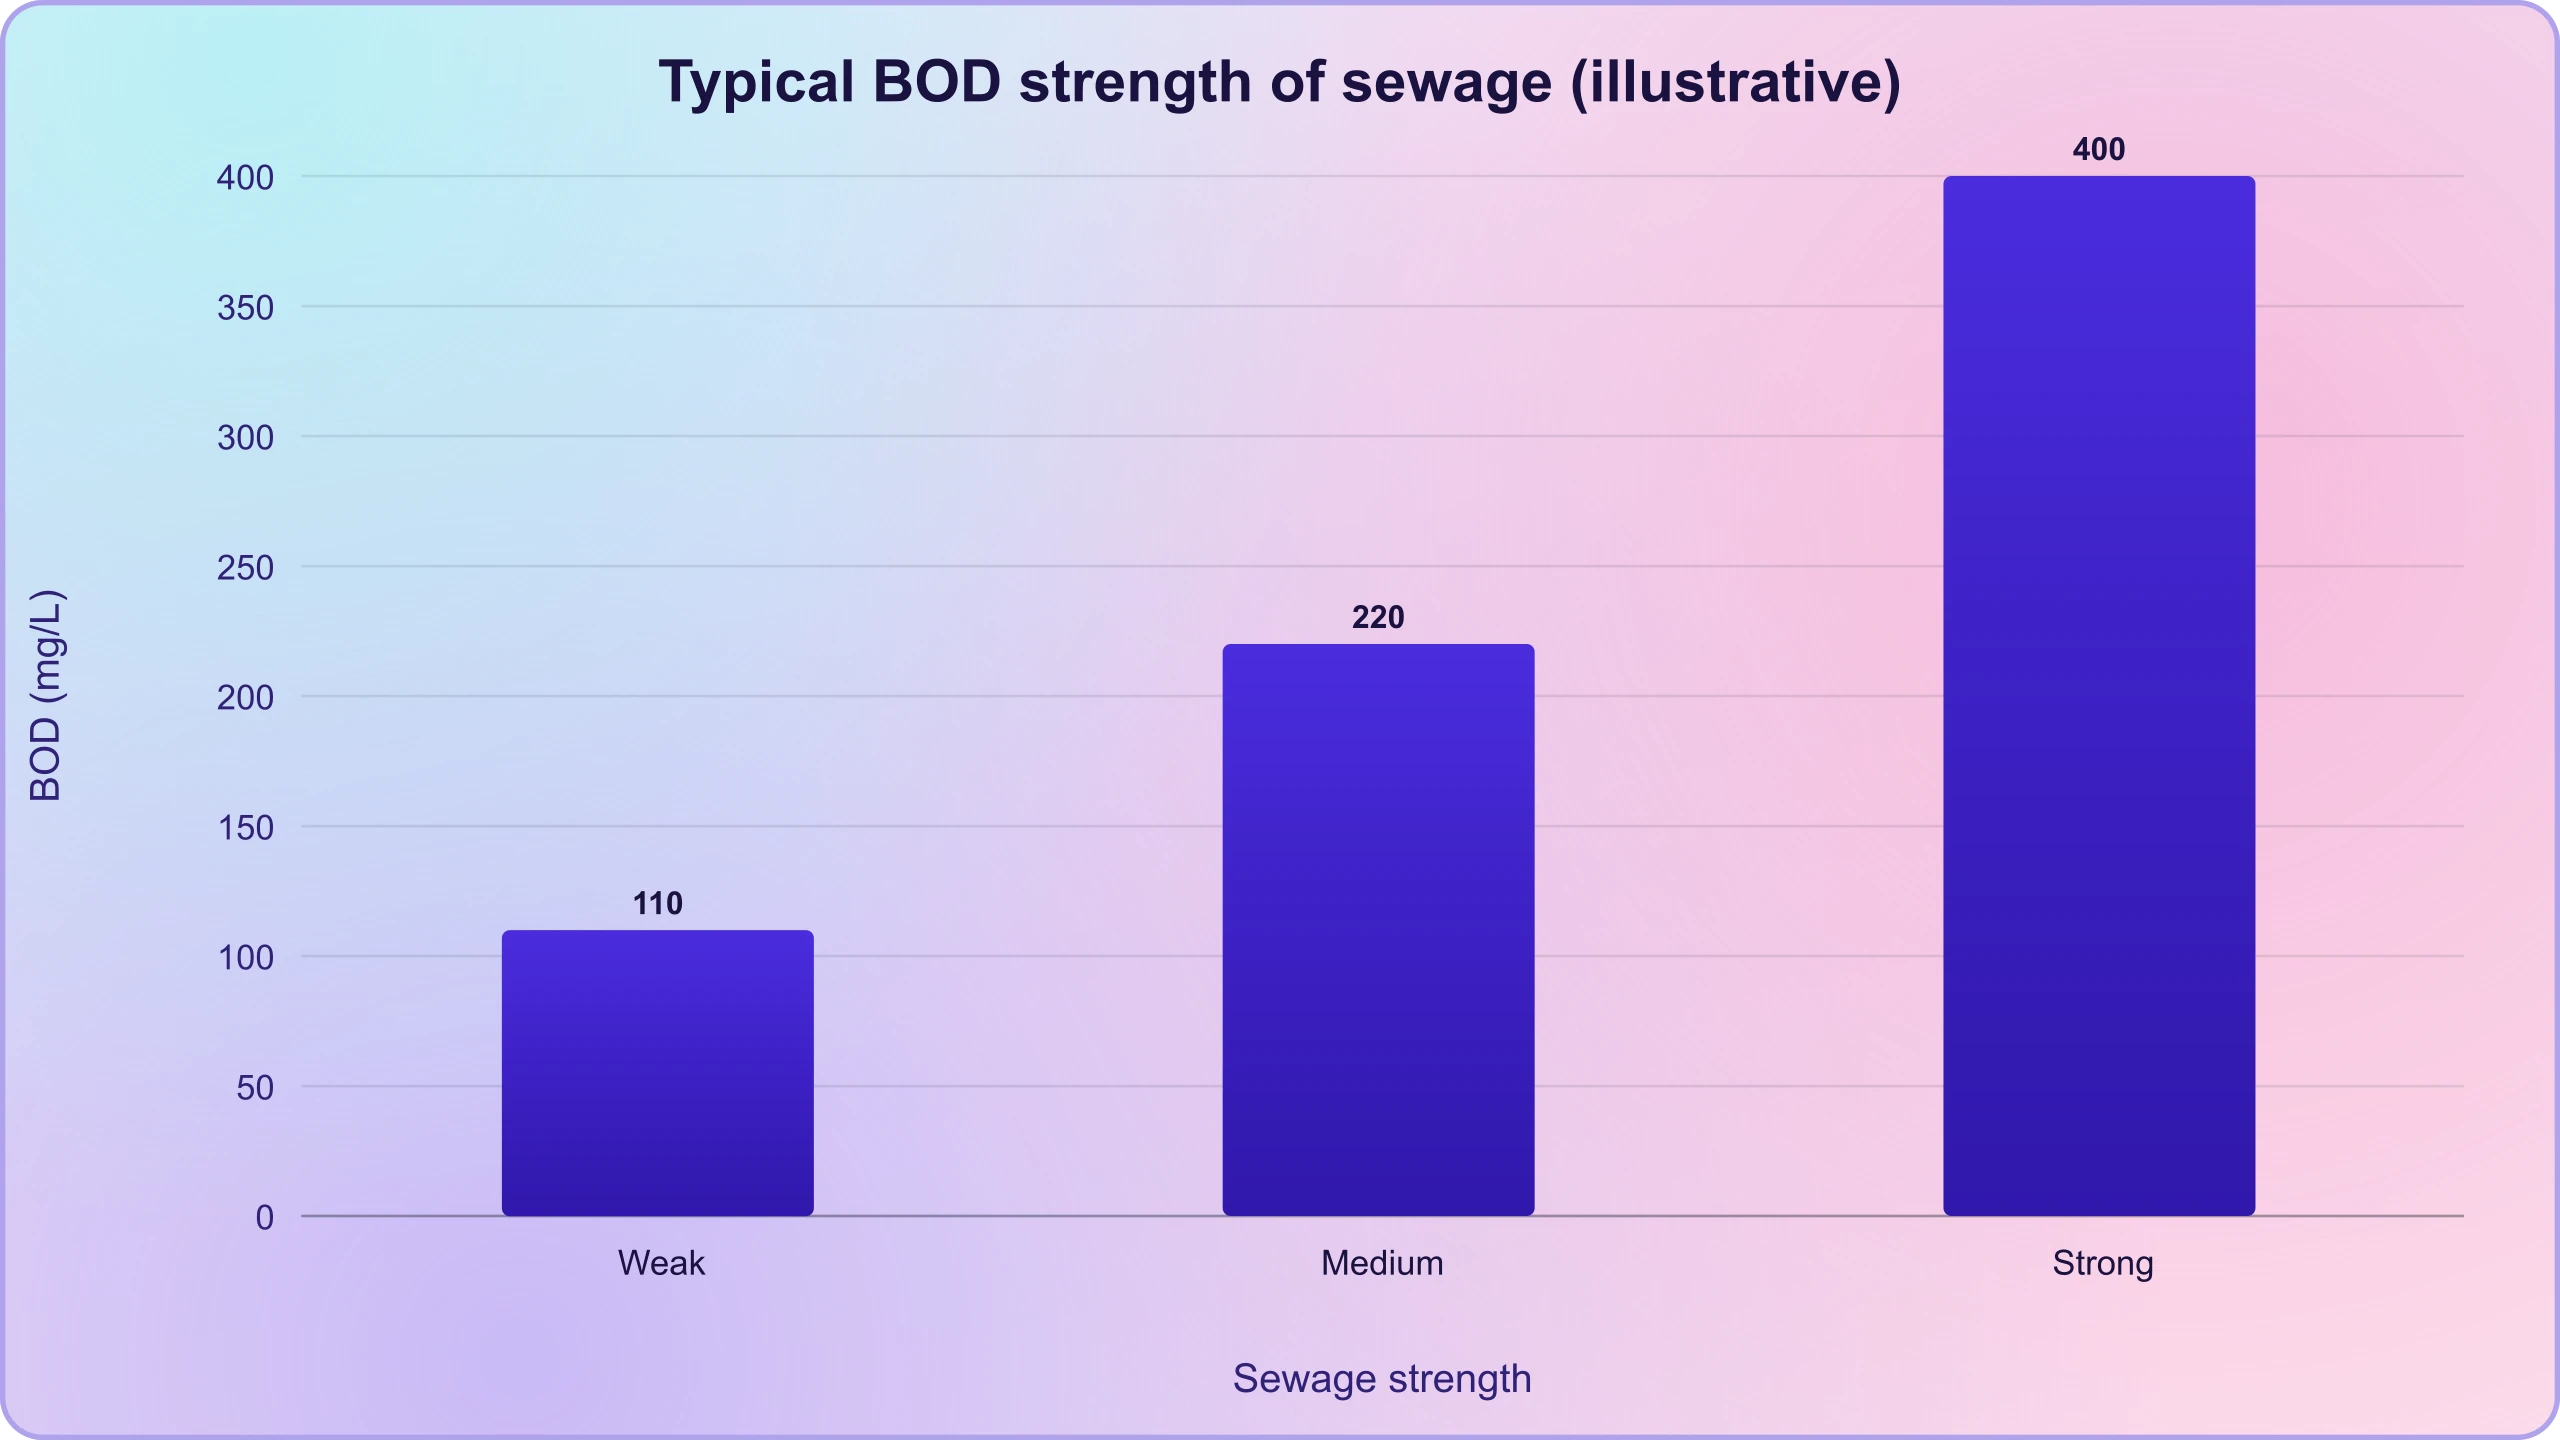
The strength of sewage is conventionally expressed through biochemical oxygen demand, the oxygen consumed by bacteria oxidising the organic matter in one litre of water. Domestic sewage typically registers a BOD of 200–300 mg/L, while industrial effluents can exceed 1,000 mg/L. Suspended solids commonly range from 200 to 400 mg/L. These figures matter because they set the treatment target: a plant must reduce BOD to roughly 20–30 mg/L before discharge. The greater the BOD of wastewater, the greater its polluting potential, and the more vigorous the microbial workforce required to bring it down.
Physical, Chemical, and Biological Loads in Raw Sewage
Each category of pollutant demands a different removal mechanism. Gross solids and grit are removed physically by screening and sedimentation. Dissolved organics are removed biologically by microbial oxidation. Nutrients such as nitrate and phosphate, which resist conventional secondary treatment, require chemical or advanced biological polishing. Pathogens are inactivated by disinfection. Recognising this mapping between pollutant type and removal mechanism is the conceptual key to the entire plant, and it explains why no single process can treat sewage completely.
Pathogenic load deserves particular emphasis. Raw sewage can carry Salmonella, Shigella, Vibrio cholerae, rotaviruses, and helminth eggs, all of which cause water-borne disease when contaminated water is used for drinking or irrigation. The World Health Organization estimates that unsafe water and sanitation contribute to hundreds of thousands of diarrhoeal deaths annually, disproportionately among children. This is why treatment is a public-health intervention as much as an environmental one, and why the final disinfection step, discussed later, is not optional.
Why Composition Dictates the Treatment Sequence
Because pollutants differ in size and solubility, treatment must proceed from coarse to fine. Screens catch what floats; grit chambers settle what is dense; primary clarifiers remove what settles slowly; aeration tanks dissolve what remains; and disinfection neutralises what survives. Reversing this order would be wasteful—disinfecting raw sewage before removing solids would consume enormous quantities of chlorine against a heavy organic demand. The sequence is therefore an economic and chemical optimisation as much as an engineering one, and every stage exists because the previous stage could not accomplish its task.
This logic also explains why plants are rated by hydraulic and organic capacity. A plant designed for a population equivalent of 100,000 people cannot simply accept twice the load without the microbial population in its aeration tanks adjusting, which takes days. Shock loads of industrial effluent can kill the microbial community and collapse treatment efficiency for weeks. Operators therefore monitor influent quality continuously, and industries are required to pre-treat their effluent before discharging into municipal sewers.
Primary Treatment: Physical Removal by Filtration and Sedimentation
Primary treatment is deliberately unglamorous: it is physical removal of particles, large and small, from the sewage through filtration and sedimentation. No microbes are deliberately cultivated here, and no dissolved organic matter is significantly degraded. The stage exists to protect the biological stage that follows, because solids would otherwise accumulate in aeration tanks, clog diffusers, and inflate the oxygen demand beyond what the blowers can supply. In a well-run plant, primary treatment removes roughly 60 per cent of suspended solids and 30–40 per cent of BOD, a substantial reduction achieved with almost no energy input beyond pumping.
The sequence within primary treatment is itself staged. Initially, floating debris is removed by sequential filtration, in which bar screens and then finer mesh screens intercept rags, plastics, and other gross material. Then the grit—soil and small pebbles—is removed by sedimentation in grit chambers, where the flow velocity is reduced just enough for dense inorganic particles to settle while lighter organic matter remains suspended. Only after these preparatory steps does the sewage enter the primary settling tank, where the bulk of settleable solids is removed.
Screening, Grit Removal, and the Primary Settling Tank
Bar screens are typically inclined steel grids with openings of 20–75 mm, mechanically raked to remove accumulated debris. Downstream, finer screens with 6–10 mm openings catch smaller material. Grit chambers follow, often designed as aerated or vortex units so that organic matter stays in suspension while sand and gravel settle. Removing grit early is critical because abrasive particles erode pumps, pipes, and sludge-handling equipment, and because grit contaminates sludge, reducing its value for digestion or land application.
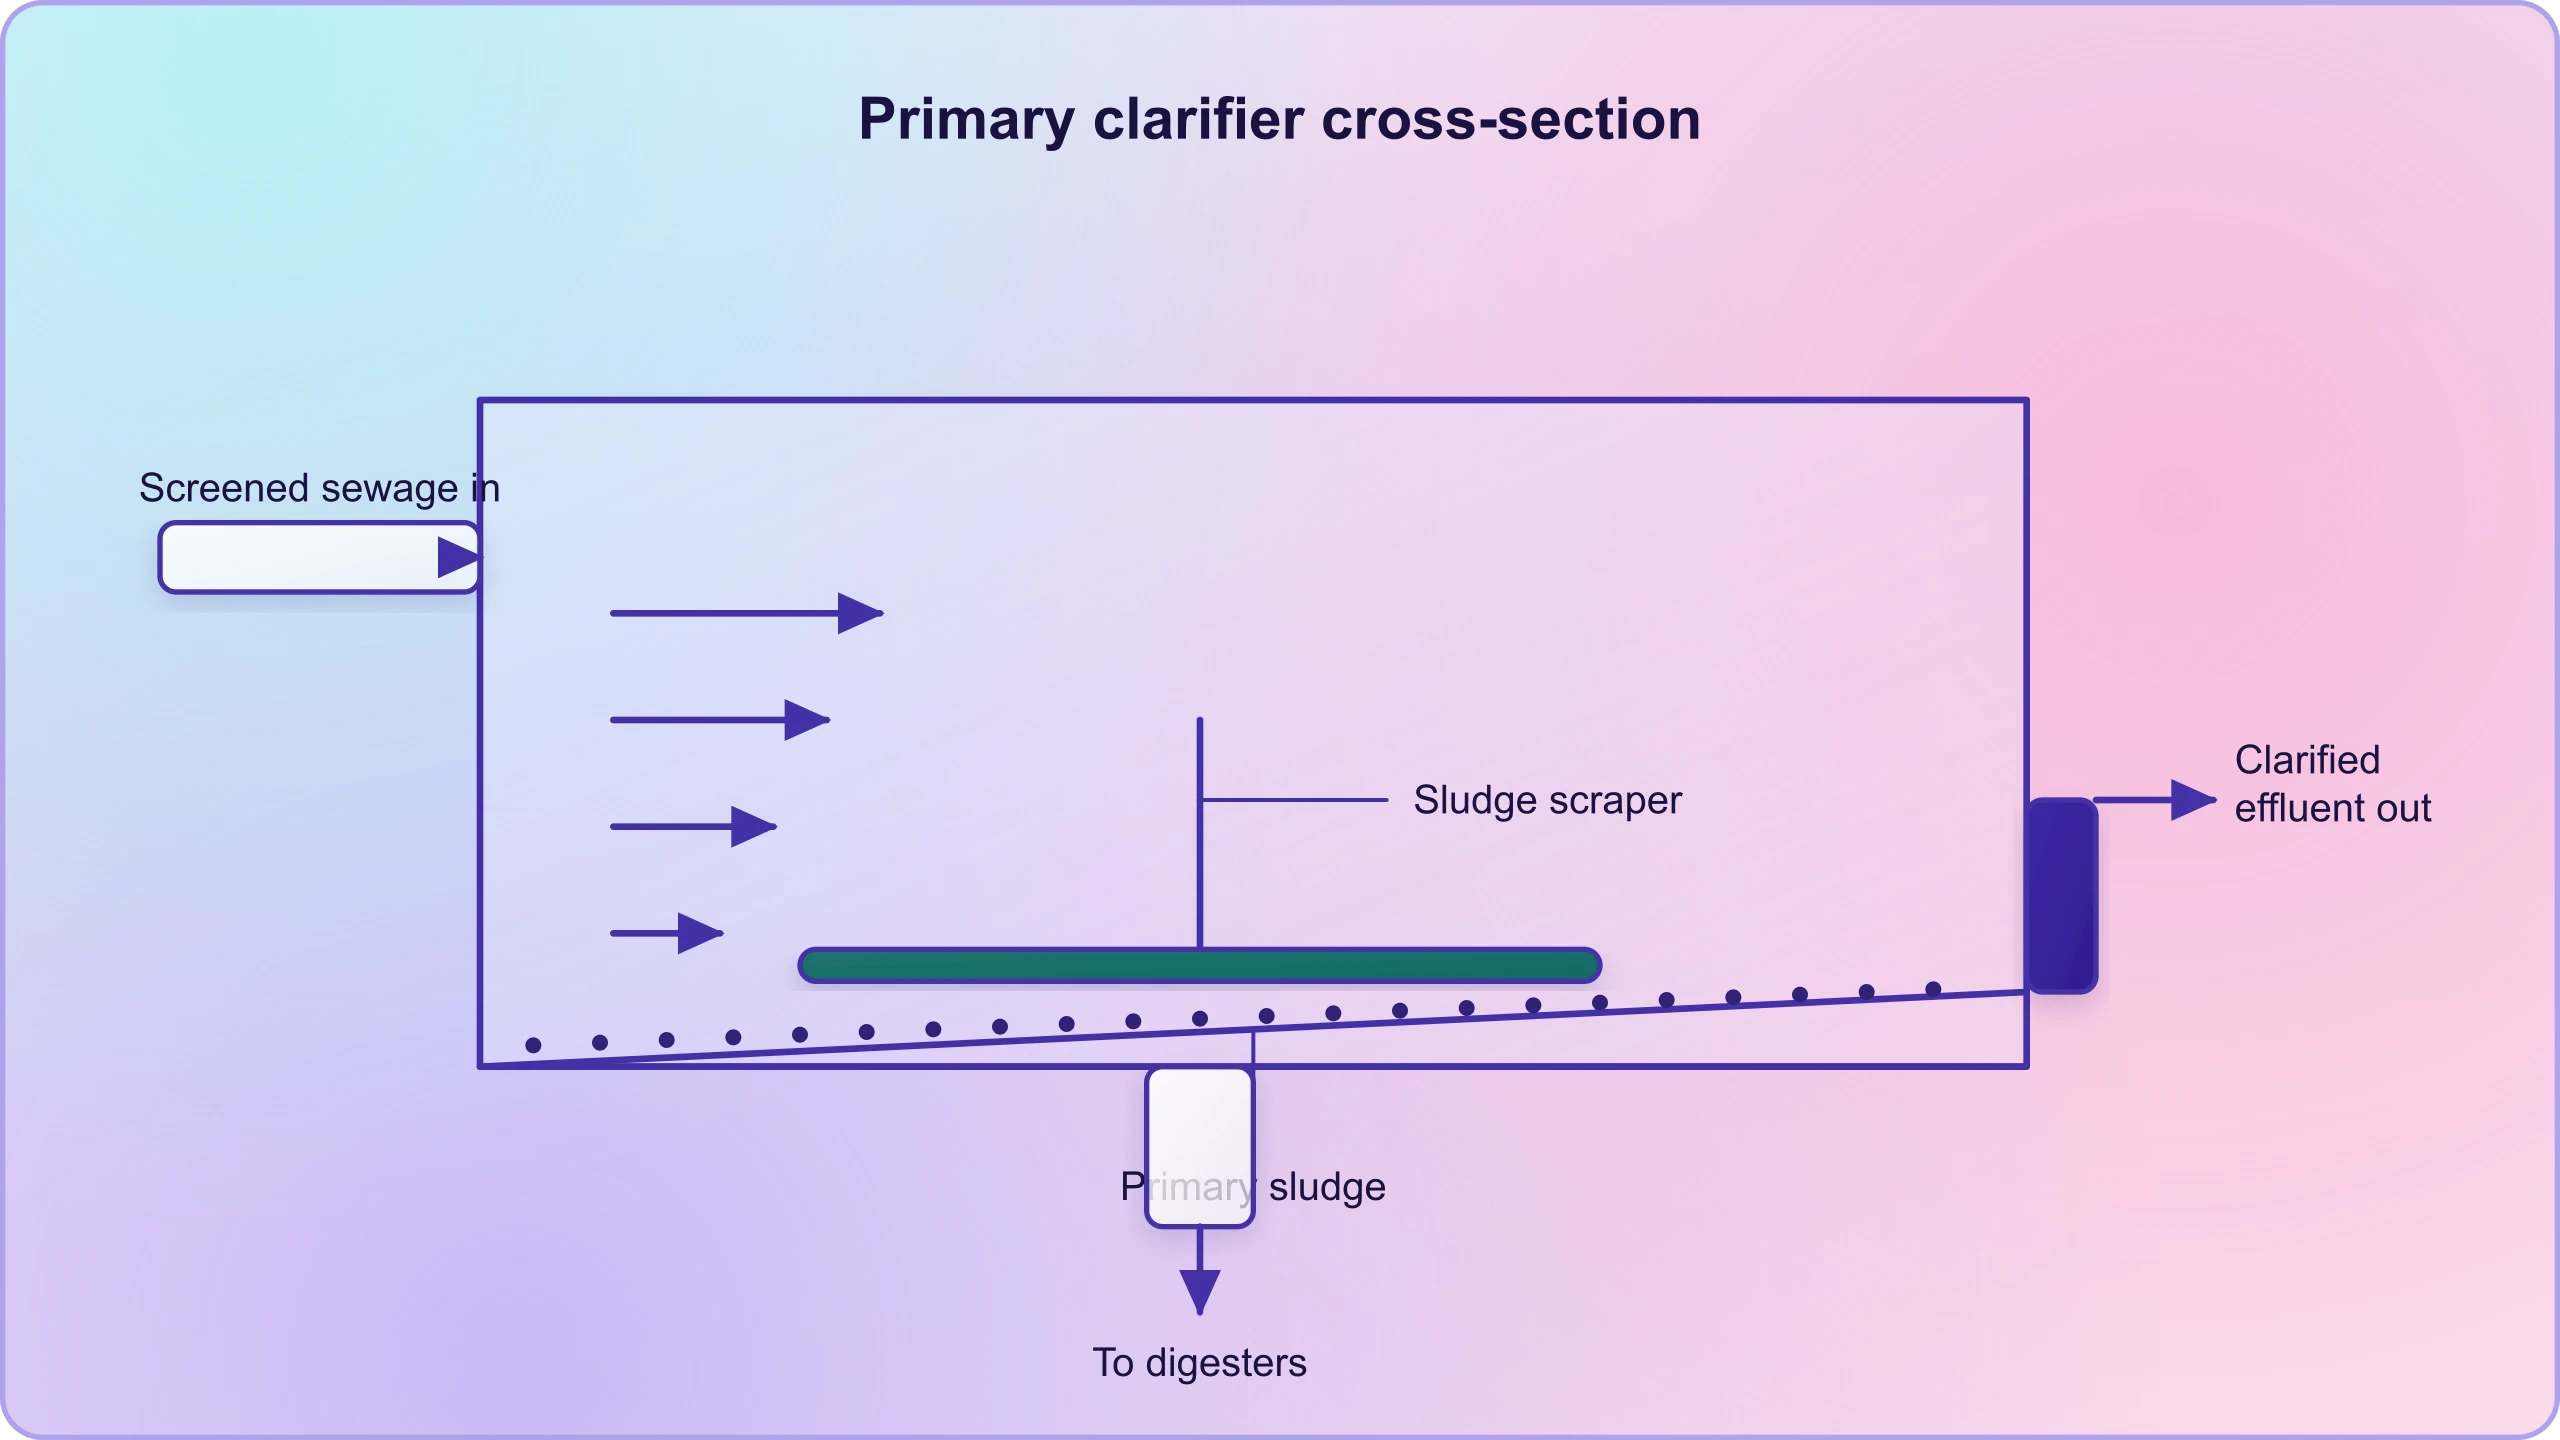
The primary settling tank, or clarifier, is a large basin in which flow velocity drops to a fraction of a metre per second, allowing particles denser than water to settle under gravity. Retention time is typically 1.5 to 2.5 hours. All solids that settle form the primary sludge, which is continuously scraped from the floor and pumped away for thickening and digestion. The supernatant forms the effluent, which flows over a weir at the far end and is taken for secondary treatment. This simple gravity separation is the workhorse of primary treatment.
Primary Sludge, Effluent, and the Limits of Physical Removal
Primary sludge is a concentrated, malodorous suspension of organic solids, typically 2–6 per cent dry matter. It is rich in energy and is therefore routed to anaerobic digesters, where it is converted into biogas—a point we will revisit. The effluent leaving the clarifier, by contrast, is relatively clear but still carries dissolved organics, colloidal matter, ammonia, phosphate, and a substantial pathogen load. Its BOD remains high enough that direct discharge would still devastate a receiving river, which is precisely why secondary treatment is indispensable.
Here lies the most common misconception in the entire subject: that primary treatment kills pathogens. It does not. Sedimentation removes some helminth eggs and a fraction of bacteria associated with settleable solids, but the effluent remains microbiologically hazardous. Viruses and many bacteria pass through unaffected. Anyone who assumes that a plant's primary stage renders sewage safe misunderstands the purpose of the process and underestimates the importance of secondary biological treatment and final disinfection.
Secondary Treatment: Cultivating Aerobic Microbes in Flocs
Secondary treatment, or biological treatment, is where microbiology takes command. The primary effluent is passed into large aeration tanks where it is constantly agitated mechanically and air is pumped into it. This allows vigorous growth of useful aerobic microbes into flocs—masses of bacteria associated with fungal filaments to form mesh-like structures. While growing, these microbes consume the major part of the organic matter in the effluent, converting it into carbon dioxide, water, and new biomass. This significantly reduces the BOD of the effluent, and the sewage water is treated until the BOD is reduced to an acceptable level.
The genius of the process lies in its self-reinforcing nature. The organic matter in sewage is the food supply; the pumped air is the oxygen supply; the flocs are the microbial workforce. As long as both food and oxygen are present, the community grows and consumes, and as it consumes, the food supply falls. The plant operator's task is to balance these inputs so that the microbes remain healthy and the effluent reaches its target. This is why aeration tanks are monitored continuously for dissolved oxygen, and why a sudden loss of air supply can turn a functioning plant into a failing one within hours.
Floc Formation and the Microbial Community
A floc is a structured aggregate, not a random clump. Filamentous bacteria such as Sphaerotilus and fungi provide a backbone of hyphae, while floc-forming bacteria secrete extracellular polymeric substances that bind cells and particles together. This mesh-like architecture traps colloidal matter and dissolved organics, bringing them into close contact with the microbial cells that will degrade them. The result is a dense, settleable, biologically active particle that behaves almost like a tiny treatment plant in its own right, and the quality of floc formation determines how well the subsequent settling step performs.
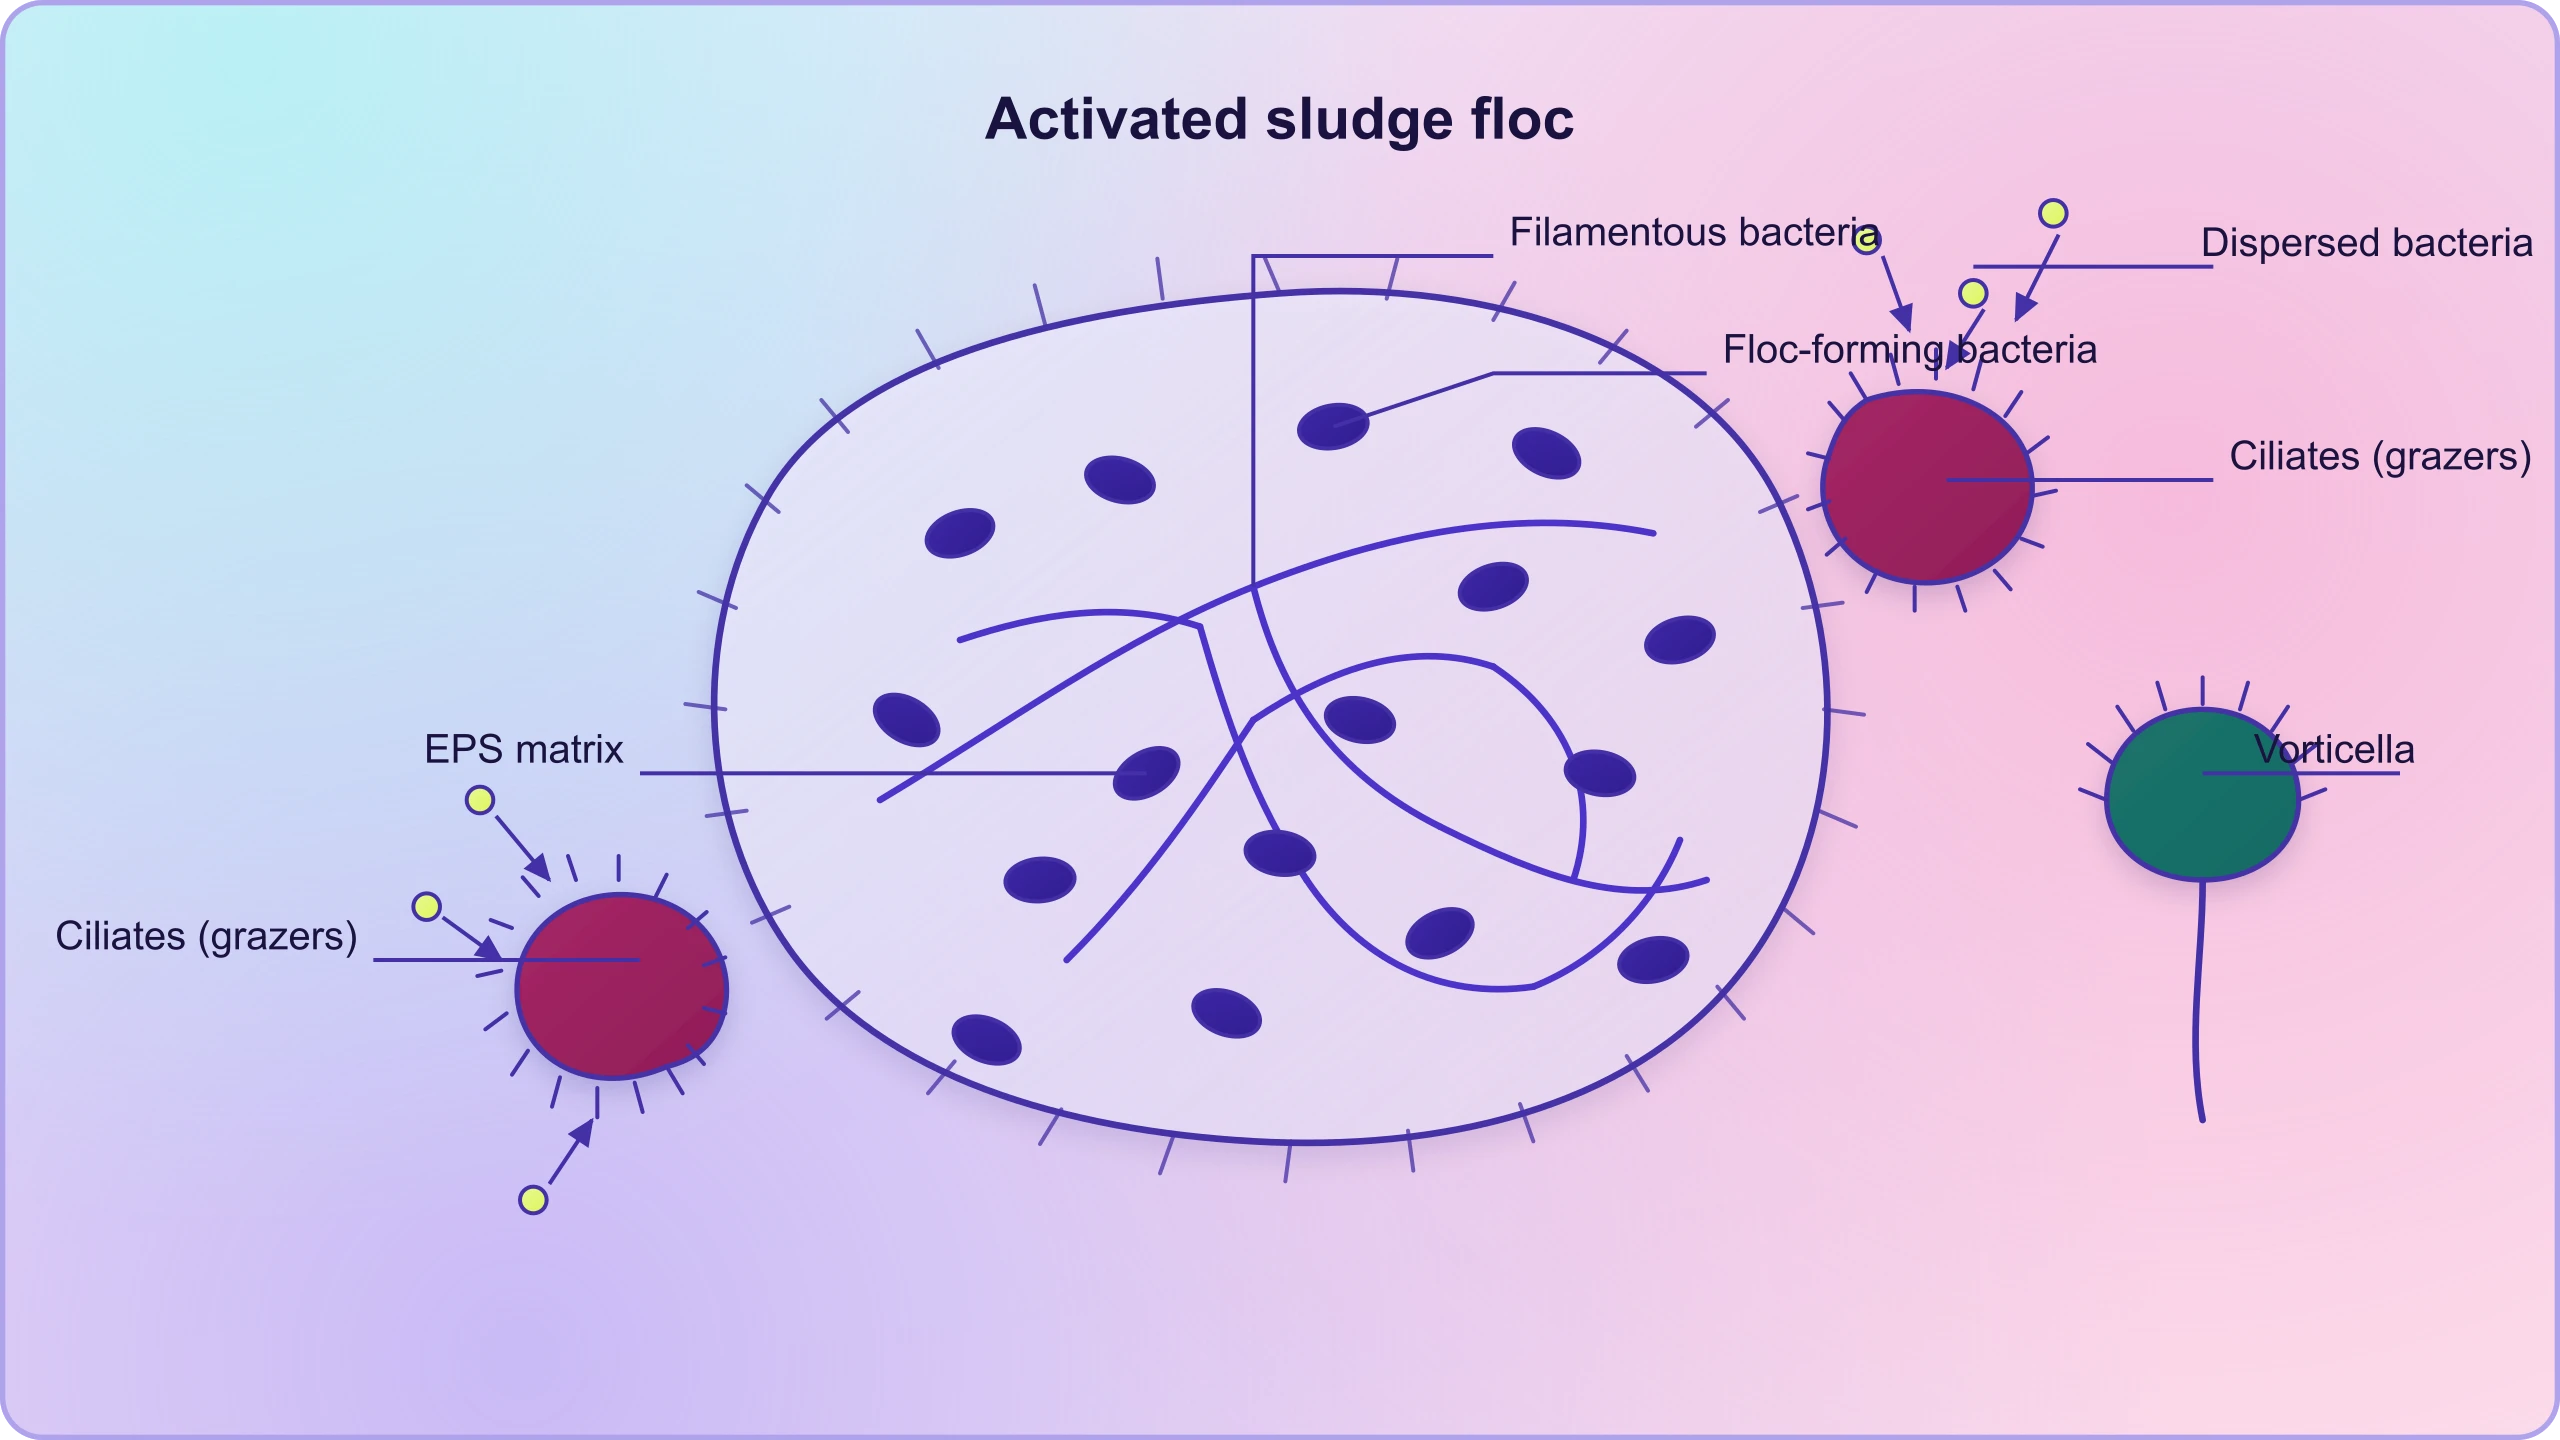
Protozoa occupy a distinctive niche within this community. Ciliates such as Paramecium and Vorticella graze on dispersed bacteria, clearing the water of free-floating cells that would otherwise escape in the effluent. By cropping bacterial populations, they keep the floc-forming species dominant and improve effluent clarity. Their presence is also diagnostic: a healthy, diverse protozoan population signals a stable, well-aerated, well-fed system, while their disappearance often warns of toxicity, oxygen depletion, or shock loading before any chemical measurement reveals the problem.
BOD Reduction and the Logic of Aeration
BOD refers to the amount of oxygen that would be consumed if all the organic matter in one litre of water were oxidised by bacteria. The BOD test measures the rate of uptake of oxygen by micro-organisms in a sample of water and thus, indirectly, is a measure of the organic matter present. The greater the BOD of wastewater, the greater its polluting potential. In secondary treatment, the microbial community is doing exactly what the BOD test simulates, only faster and under controlled conditions, so the fall in BOD across the aeration tank is a direct measure of treatment success.
Aeration serves two purposes: it supplies the oxygen that aerobic microbes require for respiration, and it keeps the flocs in suspension so that food, oxygen, and microbes remain in intimate contact. Mechanical agitation and diffused air accomplish this together. The stoichiometry is straightforward: organic matter plus oxygen yields carbon dioxide, water, and biomass. The oxygen demand of the process can be estimated from the BOD removed, and the energy cost of blowing air is typically the largest operating expense of a secondary plant.
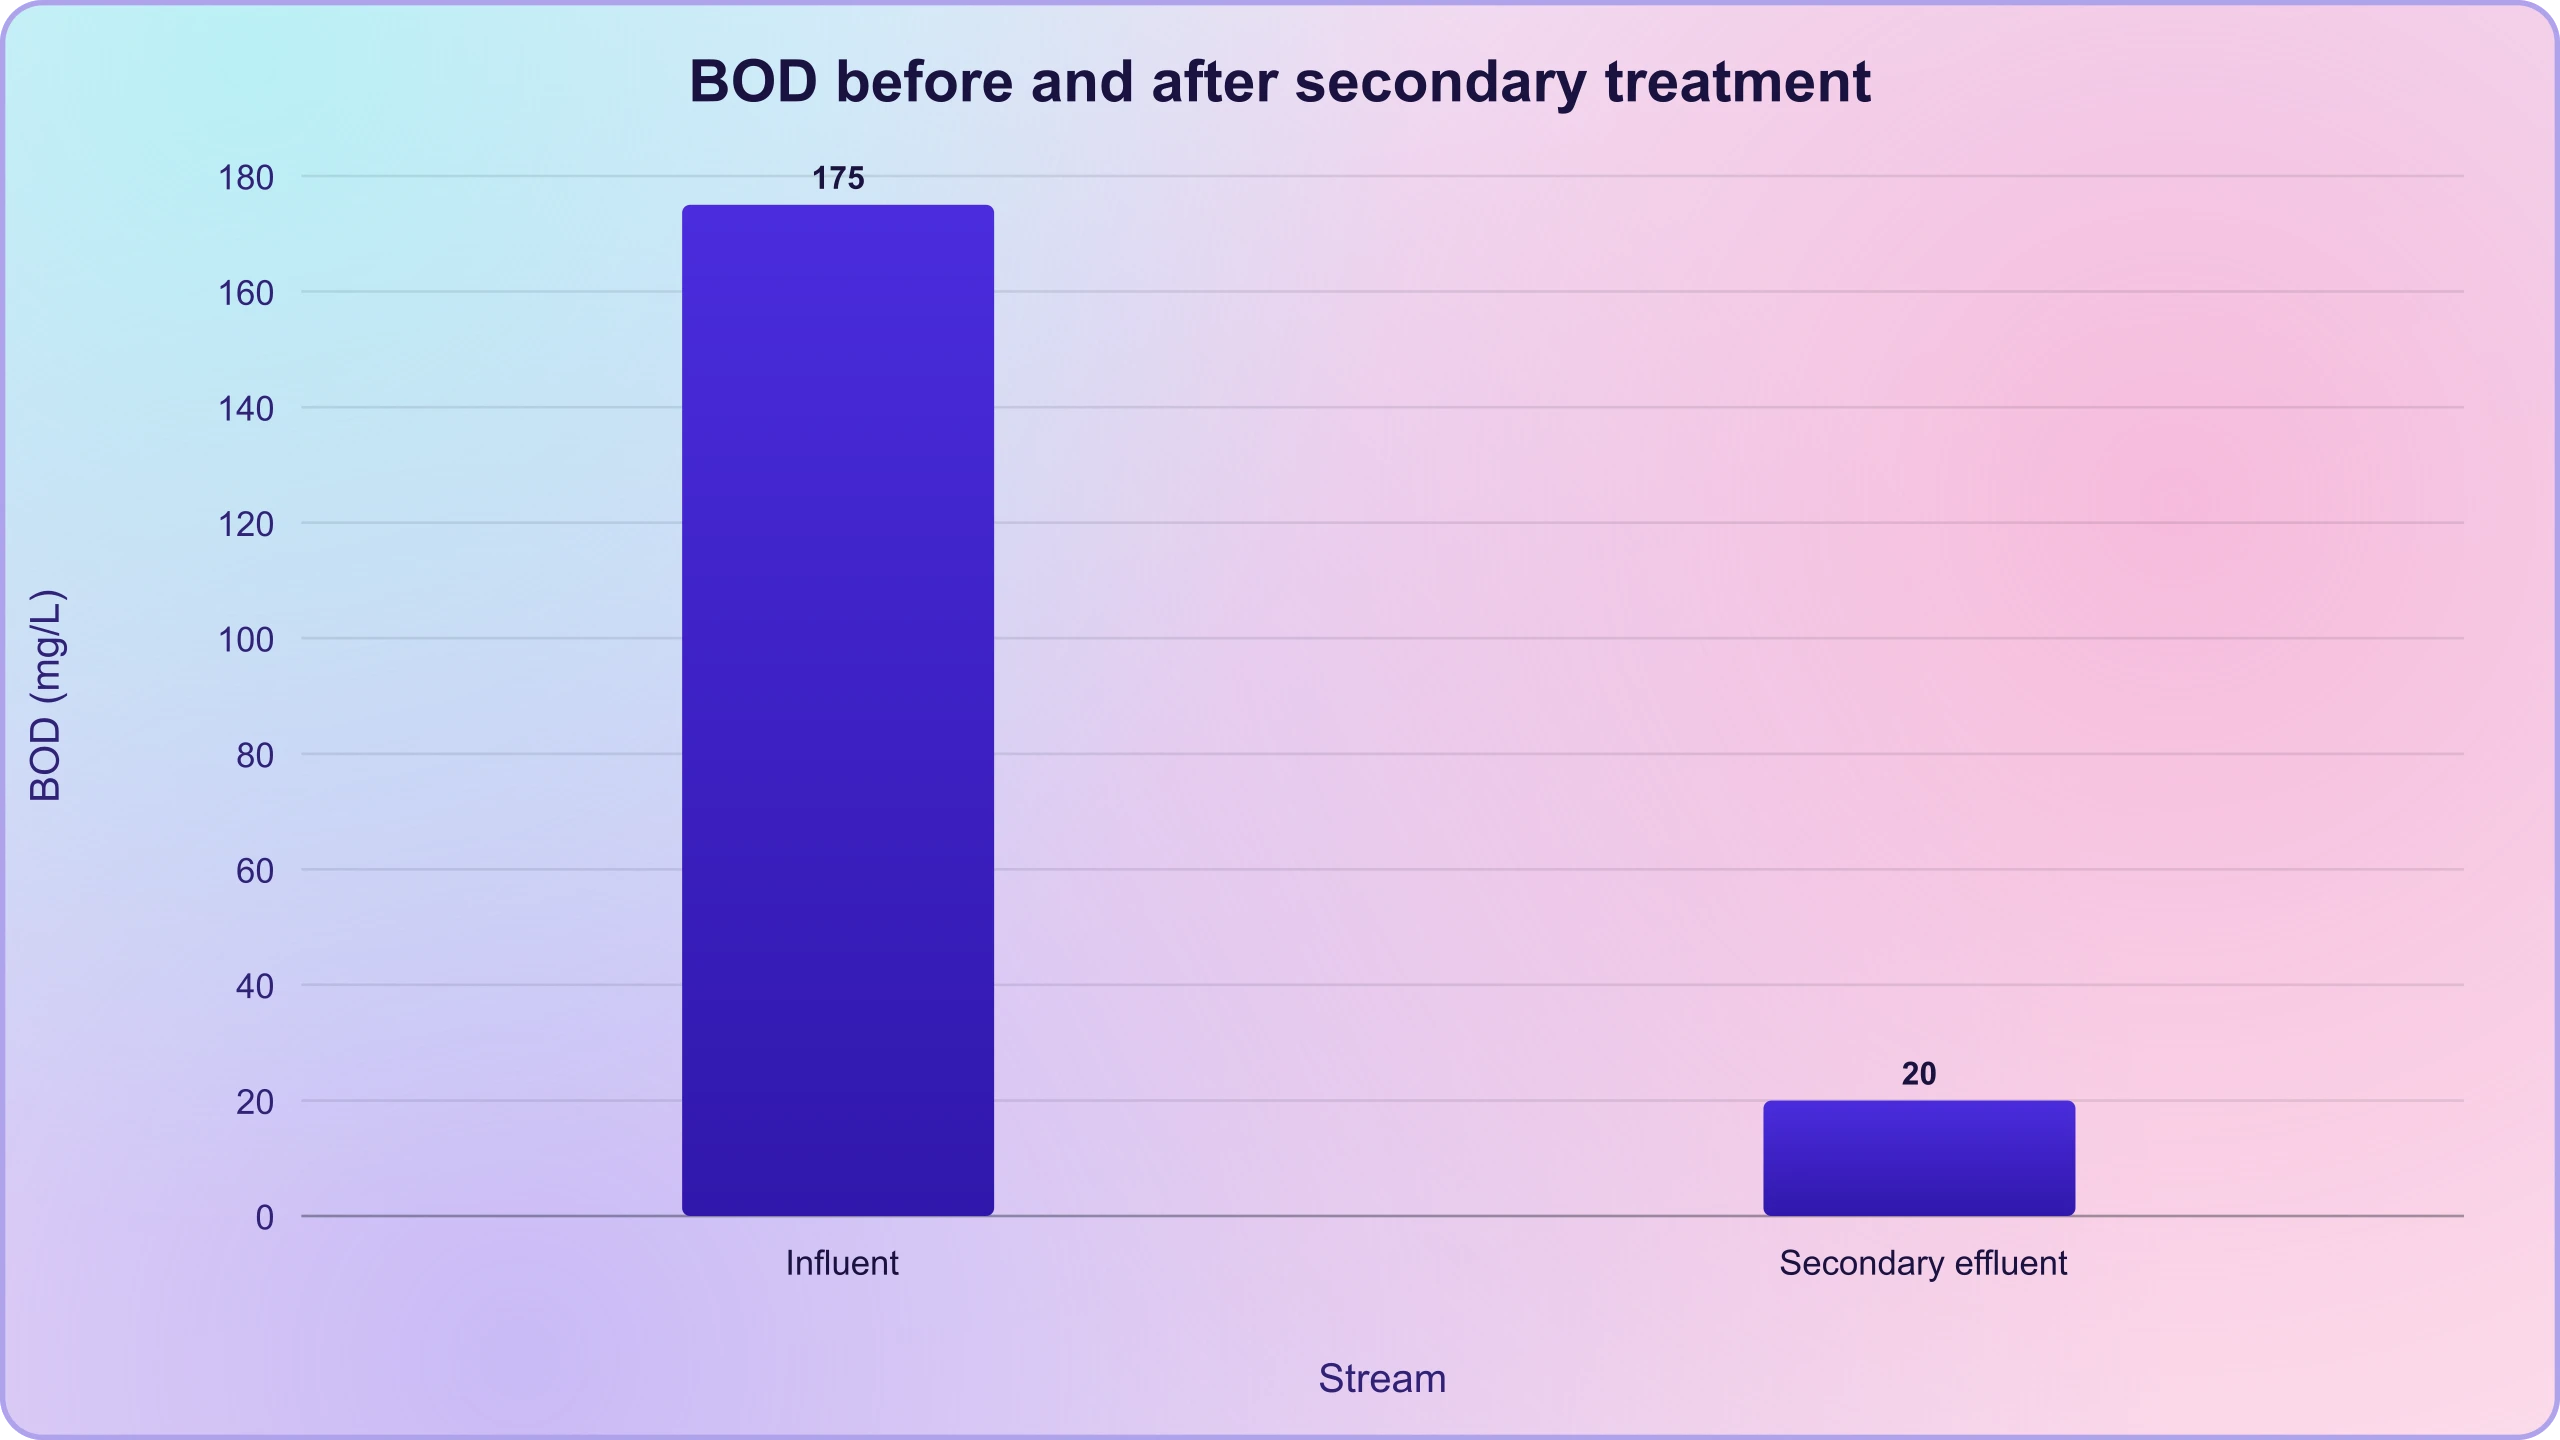
The efficiency of BOD removal in a well-operated activated sludge tank typically exceeds 85–95 per cent, bringing effluent BOD from around 150–200 mg/L down to 10–30 mg/L. This is the figure that determines compliance with discharge standards. The next lesson examines the BOD test itself in detail, including its five-day incubation protocol and its limitations, so here we need only note that BOD is the governing metric of the entire secondary stage.
Activated Sludge, Settling, and Anaerobic Digestion
Once the BOD of sewage or wastewater is reduced significantly, the effluent is passed into a settling tank where the bacterial flocs are allowed to sediment. This sediment is called activated sludge, and its name reflects its continued biological activity: it is alive, and it can be reused. A small part of the activated sludge is pumped back into the aeration tank to serve as the inoculum, seeding the incoming effluent with an established, adapted microbial community. This return of sludge is what makes the process "activated" rather than merely aerated, and it is the single most important operational innovation in the history of sewage treatment.
The remaining major part of the sludge is pumped into large tanks called anaerobic sludge digesters. Here, other kinds of bacteria, which grow anaerobically, digest the bacteria and the fungi in the sludge. During this digestion, bacteria produce a mixture of gases such as methane, hydrogen sulphide, and carbon dioxide. These gases form biogas and can be used as a source of energy because the mixture is inflammable. The effluent from the secondary treatment plant is generally released into natural water bodies like rivers and streams, though modern practice increasingly adds a tertiary stage before that release.
The Return Sludge Loop and Solids Retention
The return of activated sludge creates a loop that concentrates biomass in the system. Operators control the fraction returned, known as the return sludge ratio, to maintain a target concentration of mixed liquor suspended solids, typically 2,000–4,000 mg/L. Too little return and the microbial population washes out faster than it can grow; too much and the aeration tank becomes overloaded with solids, starving the microbes of oxygen. This balance is the daily craft of the plant operator, and it determines whether the plant meets its discharge standards or fails them.
Sludge age, or solids retention time, is the master variable. A short sludge age favours fast-growing bacteria and produces more excess sludge; a long sludge age favours slower-growing organisms, including nitrifiers that oxidise ammonia, and reduces sludge production. Many modern plants deliberately extend sludge age to achieve nutrient removal within the same tank. The interplay between sludge age, dissolved oxygen, and organic loading is the core of activated sludge process control, and it is where biology and engineering meet most intimately.
Anaerobic Digestion and Biogas Recovery
Anaerobic digestion proceeds in stages: hydrolysis breaks down complex polymers, acidogenesis produces volatile fatty acids, acetogenesis converts these to acetate, and methanogenesis—carried out by methanogens such as Methanobacterium—produces methane. The biogas typically contains 55–70 per cent methane and 30–45 per cent carbon dioxide, with traces of hydrogen sulphide. It is inflammable and can be burned to generate electricity or heat, offsetting a significant fraction of the plant's energy demand. Digestion also stabilises the sludge, reducing its volume and pathogen content before disposal.
The methanogens responsible are the same group found in the rumen of cattle, where they help break down cellulose and contribute to the nutrition of the animal. This connection is not merely academic: it explains why cattle dung is rich in these bacteria and why gobar gas plants work. In a sewage plant, the digester is effectively an artificial rumen, and the biogas it produces is a renewable energy resource generated from waste. The next lesson's focus on BOD will show how the organic load entering the plant translates into the energy that can be recovered from it.
Tertiary Treatment, Disinfection, and Environmental Impact
Secondary treatment removes organic matter and much of the microbial load, but it does not remove dissolved nutrients or guarantee pathogen-free effluent. Tertiary treatment addresses these residual concerns through nutrient removal and disinfection. Nitrogen is removed biologically by nitrification and denitrification, in which ammonia is oxidised to nitrate and then reduced to nitrogen gas. Phosphorus is removed by chemical precipitation with alum or ferric salts, or biologically by polyphosphate-accumulating organisms. These steps matter because excess nutrients in receiving waters cause eutrophication, algal blooms, and oxygen depletion.
Disinfection follows nutrient removal. Chlorination remains the most widely used method, though it produces harmful disinfection by-products such as trihalomethanes when it reacts with residual organics. Ultraviolet irradiation and ozonation are increasingly favoured because they leave no toxic residue. Membrane filtration, including microfiltration and reverse osmosis, can produce water clean enough for indirect potable reuse. Tertiary treatment is expensive, and many plants in developing countries operate without it, which is why nutrient pollution and pathogen contamination remain persistent problems in rivers receiving treated effluent.
Nutrient Removal and the Eutrophication Problem
Eutrophication is the ecological consequence of nutrient enrichment. When nitrogen and phosphorus enter a river or lake, they stimulate algal growth; when the algae die, their decomposition consumes dissolved oxygen, creating hypoxic zones in which fish and invertebrates cannot survive. The Gulf of Mexico's seasonal dead zone and the algal blooms of the Ganges basin are both consequences of nutrient loading from agricultural runoff and inadequately treated sewage. Tertiary nutrient removal is therefore not a luxury but a necessary component of any plant discharging into sensitive water bodies.
Biological nutrient removal integrates nitrification and denitrification into the activated sludge process by creating alternating aerobic and anoxic zones within the same tank. In the anoxic zone, denitrifying bacteria use nitrate as an electron acceptor and convert it to nitrogen gas, which escapes to the atmosphere. This approach is cheaper and more sustainable than chemical treatment, and it demonstrates how microbial ecology can be engineered to solve problems that physical and chemical methods handle poorly. The design of these zones is a sophisticated exercise in applied microbial ecology.
Disinfection and the Pathogen Barrier
Disinfection is the final barrier between treated sewage and public health. Chlorine doses of 5–15 mg/L with contact times of 30–60 minutes inactivate most bacteria and viruses, though protozoan cysts such as Cryptosporidium are resistant. UV disinfection damages microbial DNA and is effective against a broad range of pathogens without chemical residue, but it requires clear effluent because suspended solids shield organisms from radiation. Ozone is a powerful oxidant that inactivates bacteria, viruses, and protozoa, but it is energy-intensive and must be generated on site.
The choice of disinfection method depends on effluent quality, regulatory standards, and cost. In India, the Central Pollution Control Board sets discharge standards that include faecal coliform limits, and plants discharging into rivers used for drinking water abstraction must meet stricter criteria. Whatever the method, the principle is the same: disinfection is the last line of defence, and it cannot compensate for poor upstream treatment. A plant that fails at secondary treatment will fail at disinfection too, because the organic and solids load will overwhelm any disinfectant dose.
Case Study: The Ganga and Yamuna Action Plans
Due to increasing urbanisation, sewage is being produced in much larger quantities than ever before. However, the number of sewage treatment plants has not increased enough to treat such large quantities. So untreated sewage is often discharged directly into rivers, leading to their pollution and an increase in water-borne diseases. This is the context in which the Ministry of Environment and Forests initiated the Ganga Action Plan and the Yamuna Action Plan to save these major rivers of the country from pollution. Under these plans, it is proposed to build a large number of sewage treatment plants so that only treated sewage may be discharged into the rivers.
The Ganga Action Plan was launched in 1986, followed by the Yamuna Action Plan in 1993, with the explicit goal of intercepting, diverting, and treating sewage before it reached the rivers. The plans funded the construction of treatment plants, pumping stations, and sewer networks in towns along the riverbanks. Their logic was straightforward: if the flow of untreated sewage could be intercepted and treated, the river's water quality would recover. In practice, the challenge proved far more complex than the engineering, because treatment capacity must keep pace with population growth and because plants must be operated and maintained long after construction.
What the Plans Achieved and Where They Fell Short
The plans created substantial treatment infrastructure and raised public awareness of river pollution, but independent evaluations found persistent gaps. Many plants were underutilised because sewer networks were incomplete, so sewage never reached them. Others suffered from power interruptions, inadequate maintenance, and insufficient skilled staff. Industrial effluent and agricultural runoff added pollution loads that the plans were not designed to address. The lesson is that treatment plants are necessary but not sufficient: without reliable operation, adequate funding, and complementary regulation of industrial and agricultural sources, river water quality improves slowly.
The successor programme, Namami Gange, launched in 2014, attempted to address these gaps with a more integrated approach, including riverfront development, afforestation, and public participation alongside treatment infrastructure. The experience of the Ganga and Yamuna plans is therefore a case study in the difference between building treatment capacity and achieving environmental outcomes. It also underscores the value of the microbial processes described in this lesson: every functioning plant along these rivers depends on the same floc-forming bacteria and methanogens that we have examined, and their performance determines whether the investment translates into cleaner water.
Environmental Consequences of Untreated Sewage
When untreated sewage enters a river, the organic load stimulates bacterial growth that consumes dissolved oxygen, creating hypoxic conditions lethal to fish and aquatic invertebrates. Nutrients trigger algal blooms that further deplete oxygen when they decay. Pathogens contaminate drinking water sources and recreational waters, causing cholera, typhoid, hepatitis A, and diarrhoeal disease. Heavy metals and pharmaceutical residues accumulate in sediments and enter the food chain. The cumulative effect is a river that is biologically impoverished and unsafe for human use, which is precisely the condition the action plans sought to reverse.
The scale of the challenge is enormous. India generates tens of thousands of millions of litres of sewage daily, and a substantial fraction remains untreated. Globally, UNESCO estimates that over 80 per cent of wastewater is released without adequate treatment. This is why the microbial method of sewage treatment, practised for more than a century in almost all parts of the world, remains so important. Till date, no man-made technology has been able to rival the microbial treatment of sewage, and the reason is that microbes perform the work at ambient temperature and pressure, using the pollutants themselves as fuel.
Worked Examples and Common Misconceptions
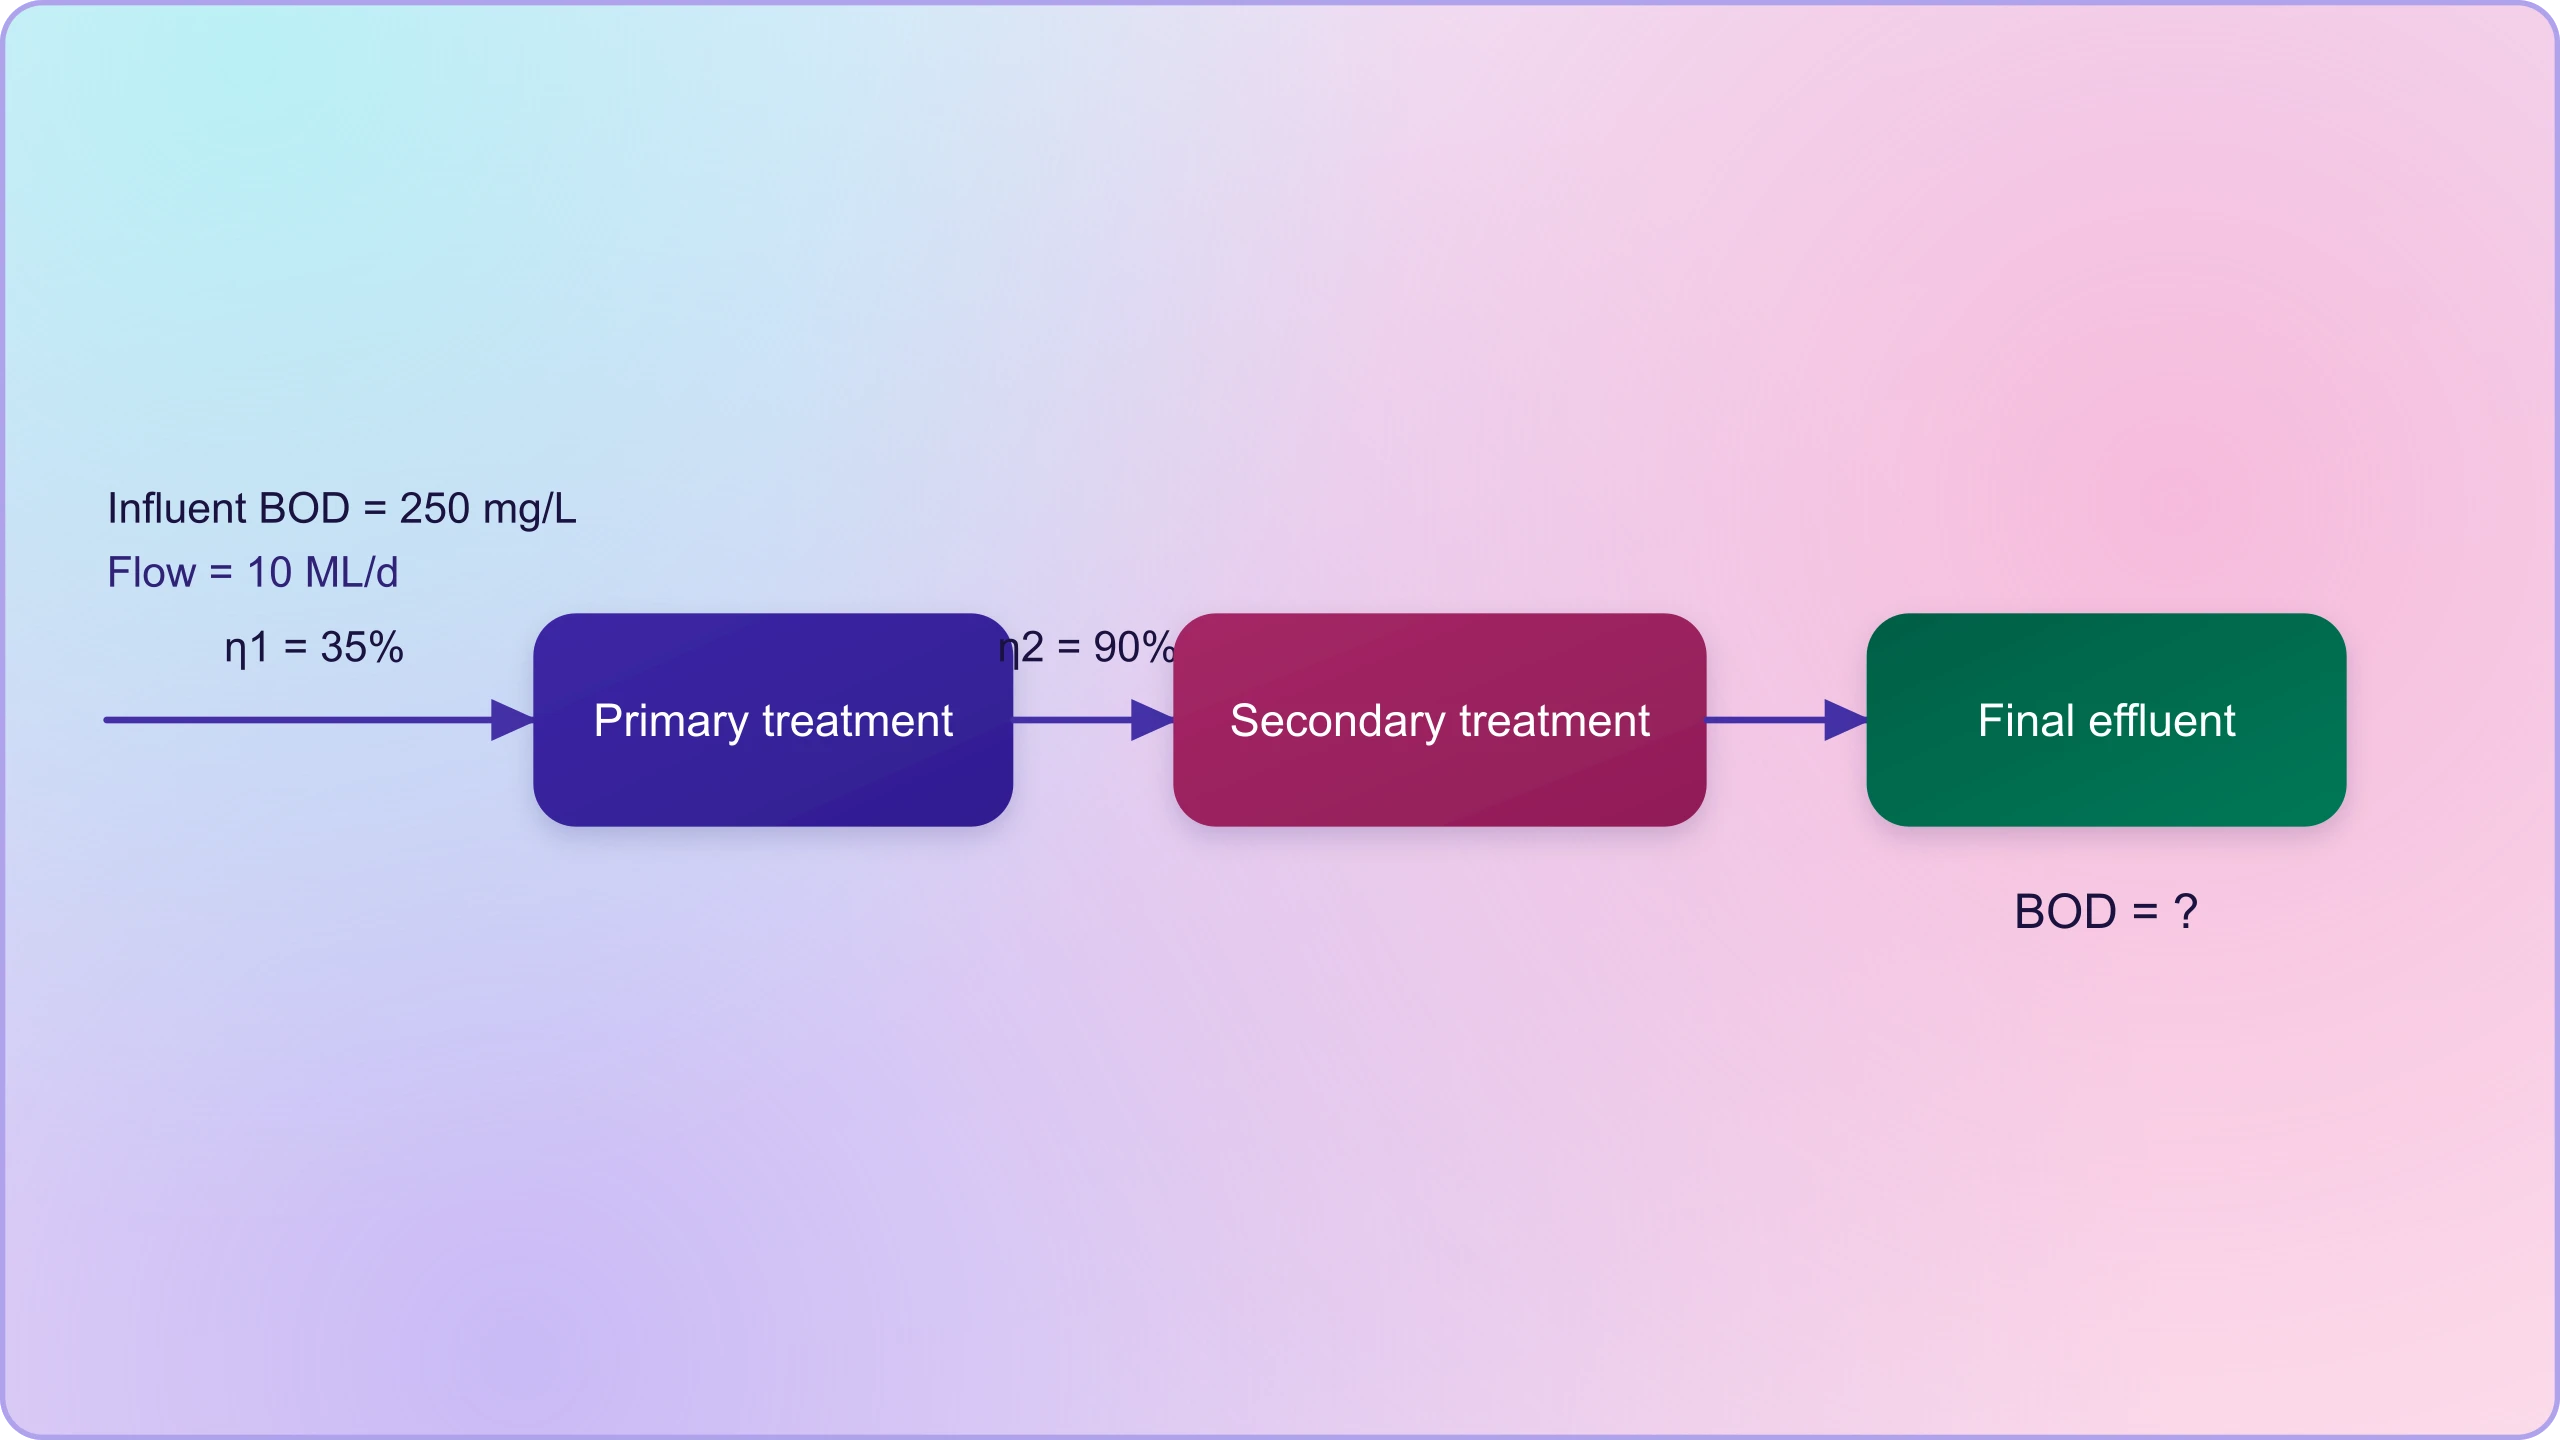
Applying the concepts to numerical problems consolidates understanding and reveals how the stages connect quantitatively. Consider a plant receiving sewage with a BOD of 250 mg/L and a flow of 10 million litres per day. Primary treatment removes 35 per cent of BOD, leaving 162.5 mg/L. Secondary treatment removes 90 per cent of the remainder, leaving 16.25 mg/L, comfortably below a typical 30 mg/L discharge standard. The calculation shows how each stage contributes and why both are necessary: primary alone would leave 162.5 mg/L, far above the standard, while secondary alone would face an excessive organic load.
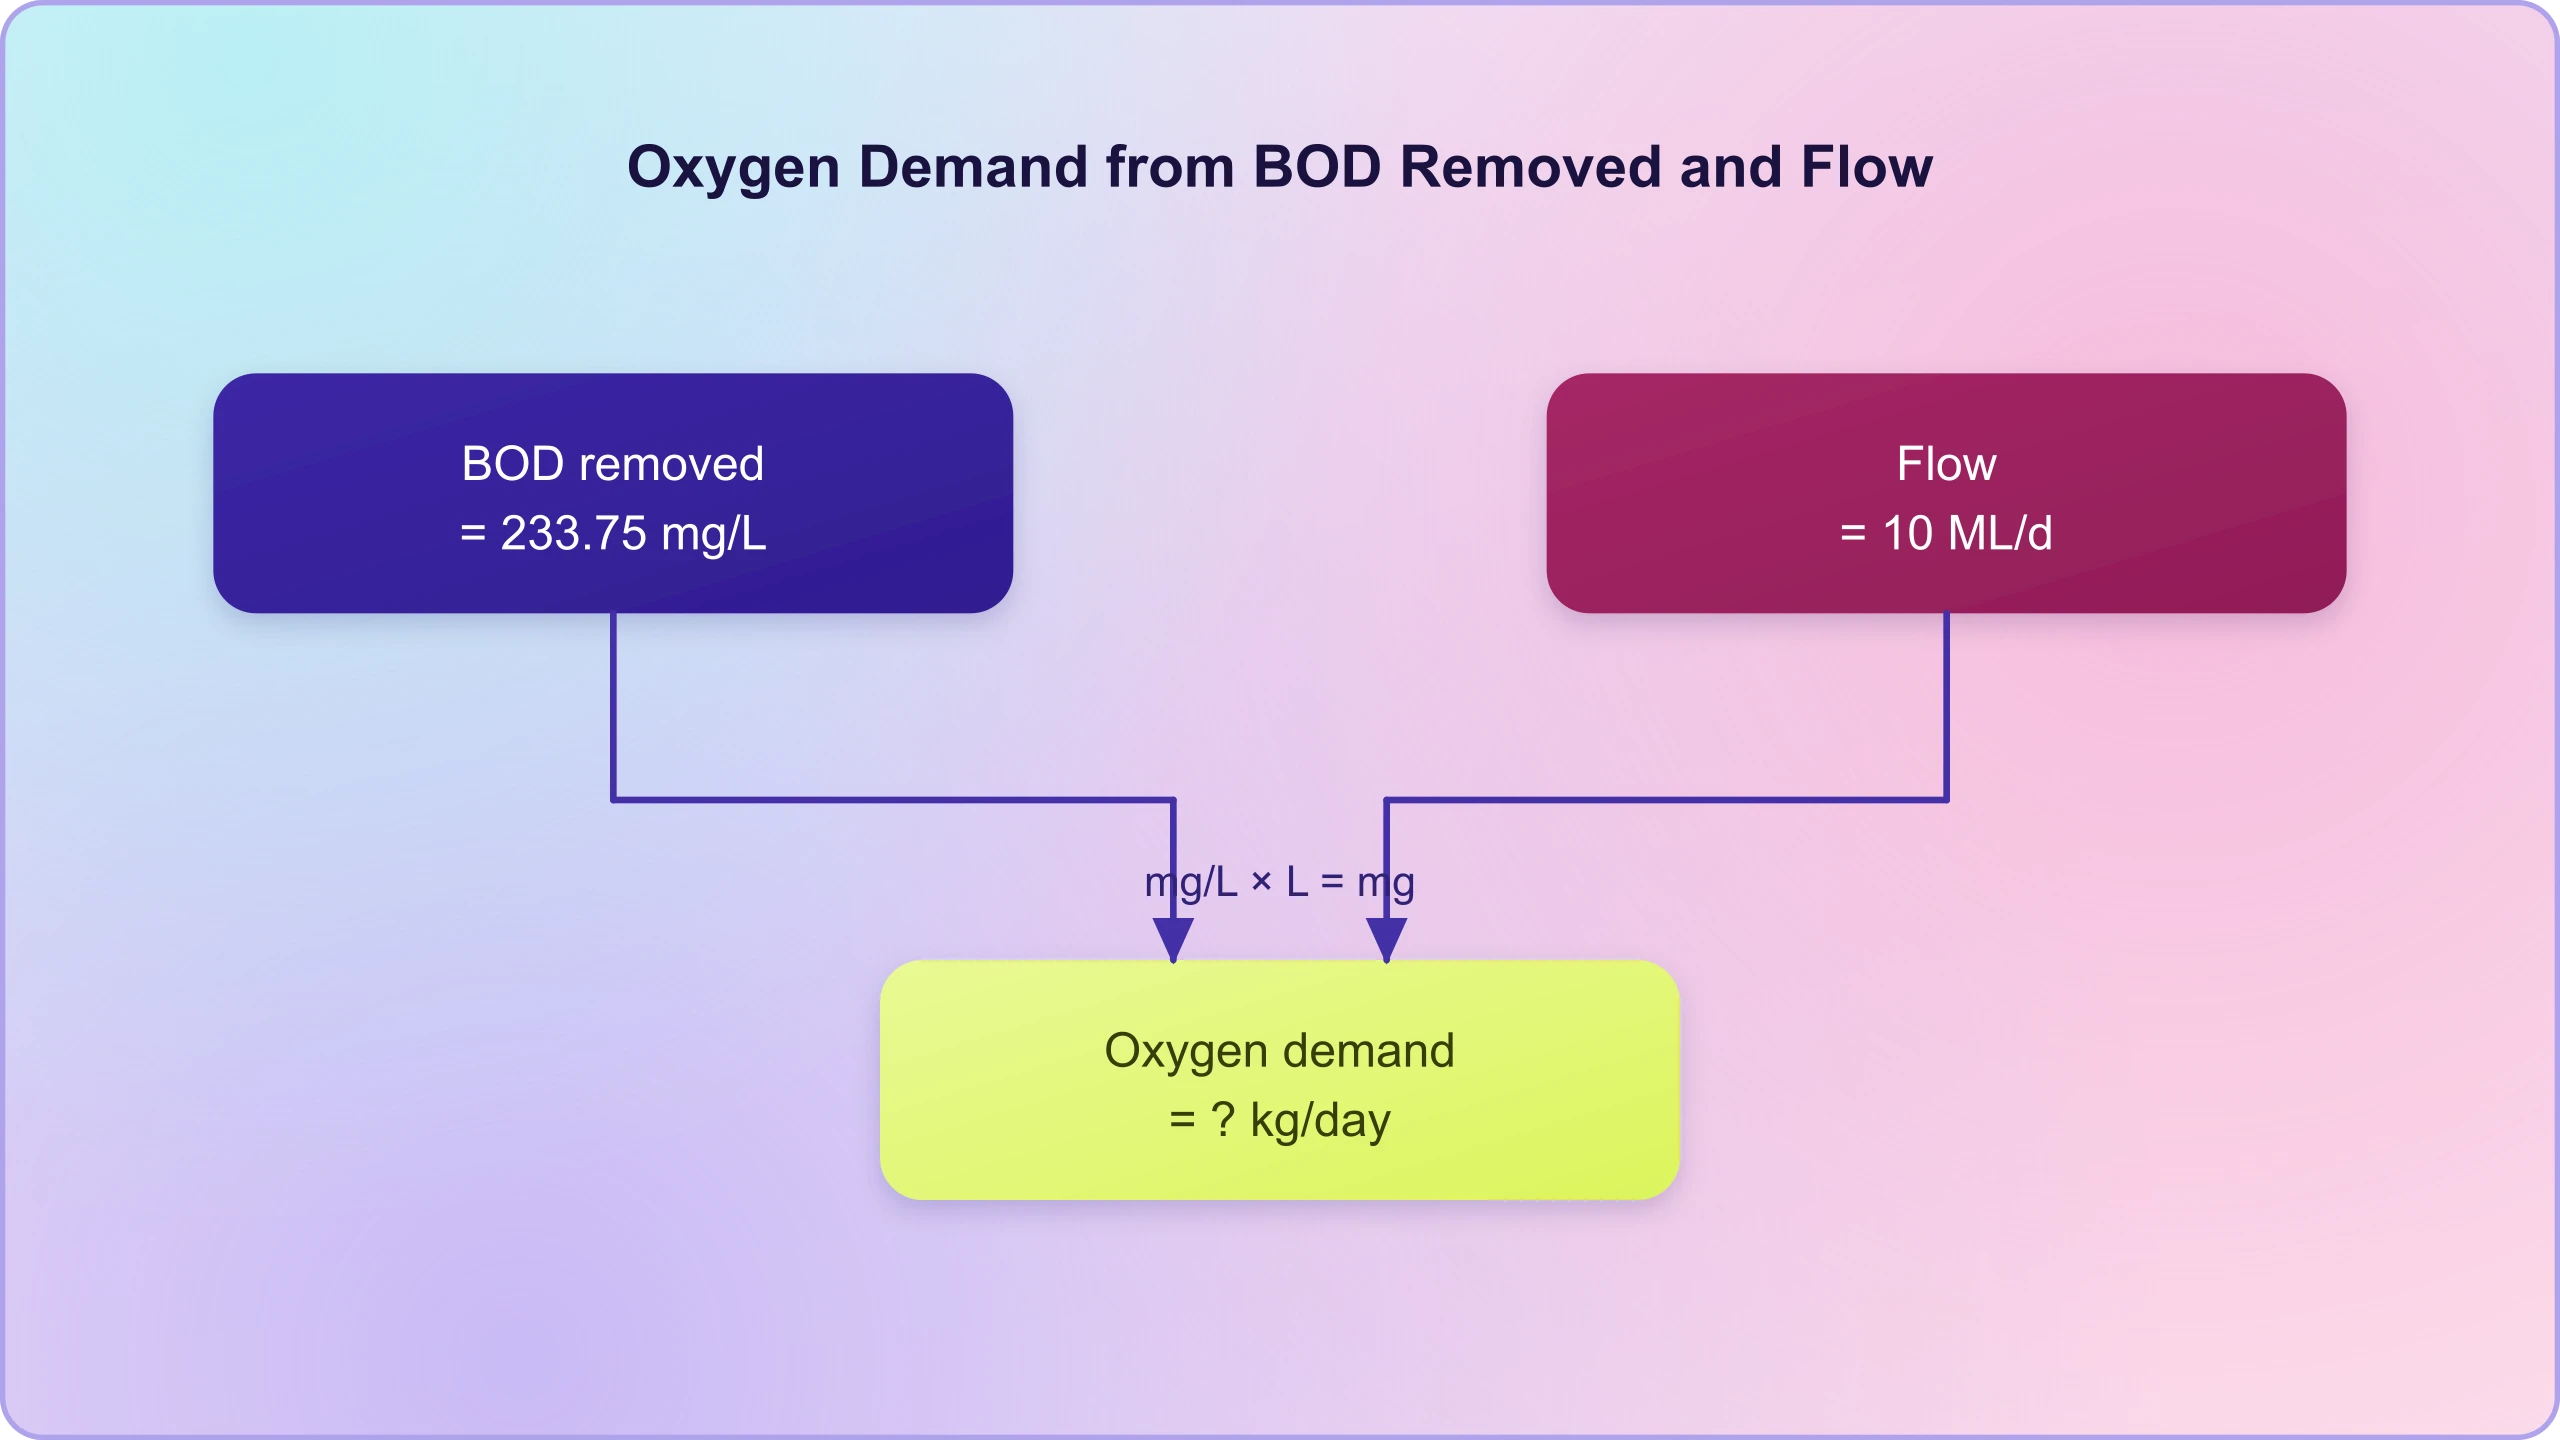
Another useful calculation concerns oxygen demand. If the plant removes 233.75 mg/L of BOD across both stages, and the flow is 10 million litres per day, the total oxygen demand satisfied by microbes is the product of BOD removed and volume. Converting units, this is approximately 2,338 kg of oxygen per day, which must be supplied by the aeration blowers. This figure drives the sizing of blowers and the plant's electricity bill, and it explains why energy efficiency in aeration is a major focus of modern plant design.
Calculating Stage-by-Stage BOD Reduction
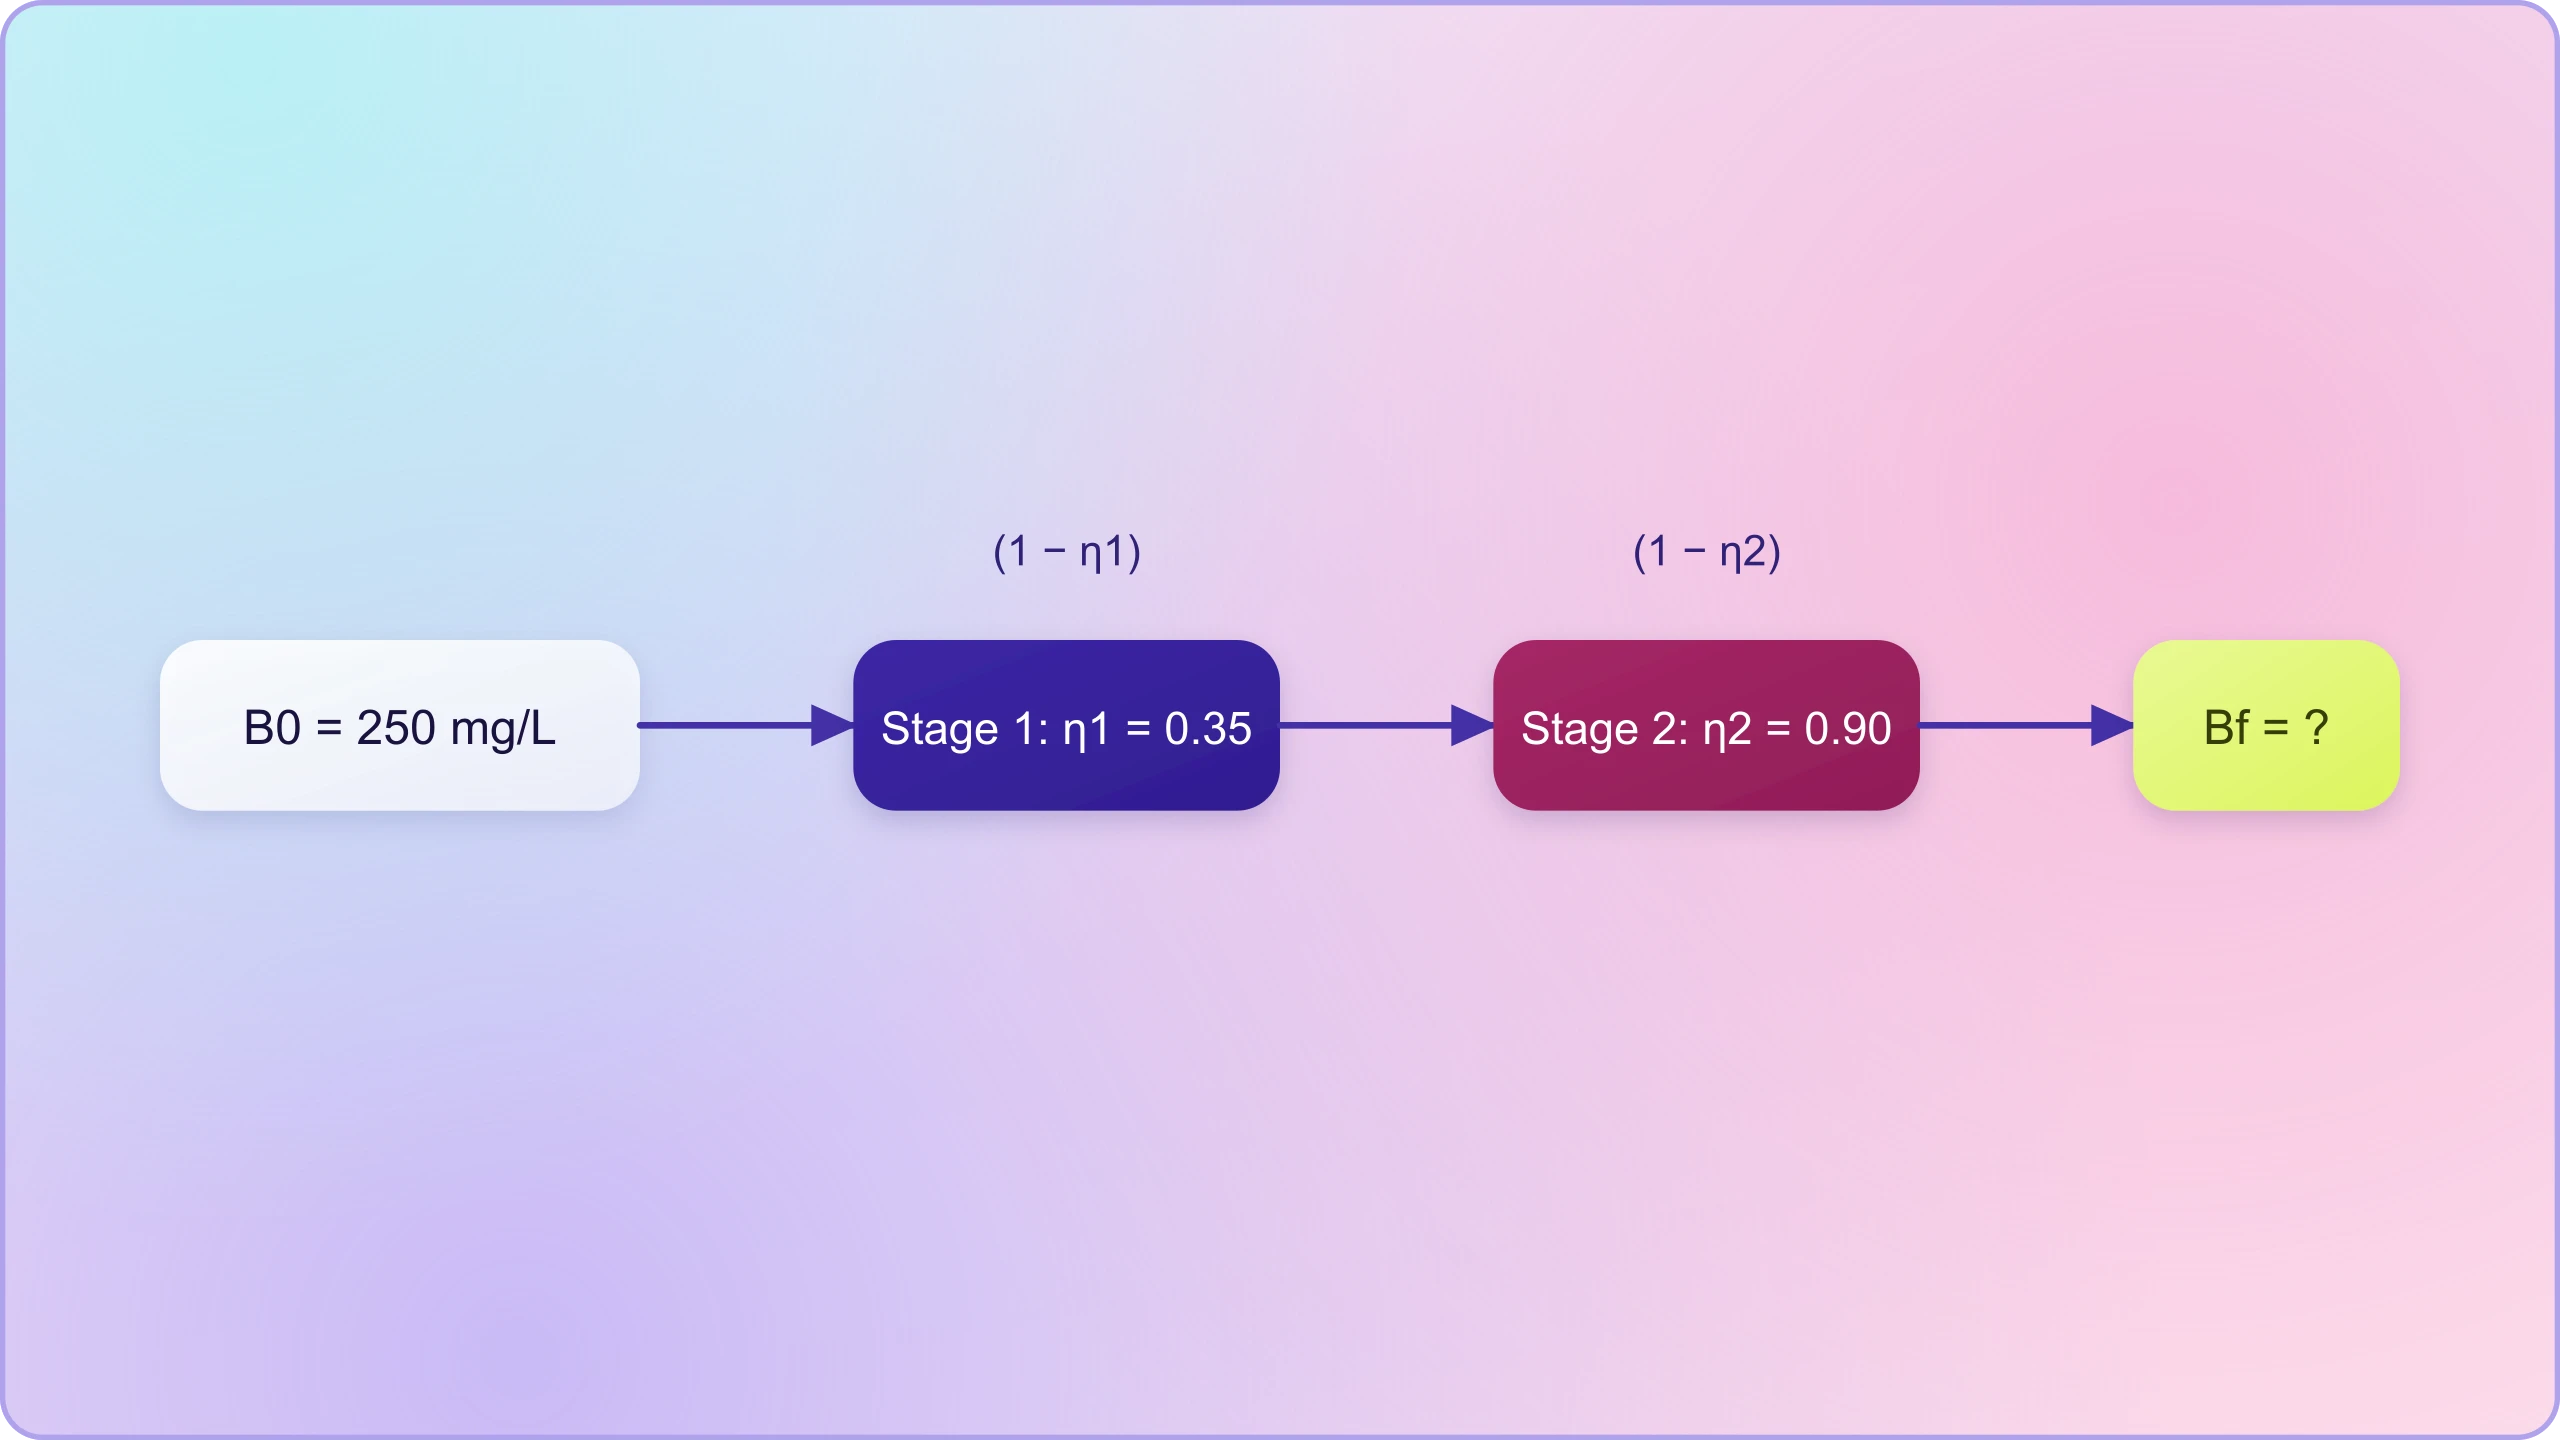
Let us formalise the calculation. If influent BOD is ##B_0##, primary removal efficiency is ##\eta_1##, and secondary removal efficiency is ##\eta_2##, the final BOD is given by the expression below. This simple model assumes first-order removal in each stage, which is a reasonable approximation for teaching purposes, though real plants exhibit more complex kinetics.
Substituting ##B_0 = 250## mg/L, ##\eta_1 = 0.35##, and ##\eta_2 = 0.90## gives ##B_f = 250 \times 0.65 \times 0.10 = 16.25## mg/L. The multiplicative structure is important: efficiencies compound, so a modest primary removal followed by a strong secondary removal can achieve a very low final BOD. It also shows the danger of a failing secondary stage: if ##\eta_2## drops to 0.50, the final BOD rises to 81.25 mg/L, well above standard, even though primary treatment is unchanged.
A short script can generalise this calculation for any set of parameters, which is useful for exploring how sensitive the final BOD is to each stage's performance. The code below computes final BOD and the oxygen demand satisfied, and it can be adapted to different flows and efficiencies.
def final_bod(b0, eta1, eta2):
    return b0 * (1 - eta1) * (1 - eta2)

def oxygen_demand_kg_per_day(b0, bf, flow_mld):
    bod_removed = b0 - bf          # mg/L
    volume_litres = flow_mld * 1e6 # litres per day
    mg_per_day = bod_removed * volume_litres
    return mg_per_day / 1e6        # kilograms per day

b0, eta1, eta2, flow = 250, 0.35, 0.90, 10
bf = final_bod(b0, eta1, eta2)
print(f"Final BOD: {bf:.2f} mg/L")
print(f"Oxygen demand: {oxygen_demand_kg_per_day(b0, bf, flow):.0f} kg/day")
Misconceptions Worth Correcting
The first misconception is that primary treatment kills pathogens. As established, it does not; sedimentation removes some solids-associated organisms but leaves the effluent microbiologically hazardous. The second is that aeration tanks are simply holding ponds; in fact, they are carefully controlled bioreactors in which dissolved oxygen, mixing, and sludge age are actively managed. The third is that biogas is a minor by-product; in a well-run plant, it can supply a substantial share of the plant's energy needs, turning a waste stream into a resource. The fourth is that treatment ends at secondary stage; nutrient removal and disinfection are essential for protecting receiving waters.
A fifth misconception concerns flocs: students sometimes imagine them as inert clumps. In reality, a floc is a living community with a food web, in which bacteria consume organics, protozoa graze on bacteria, and filamentous organisms provide structure. Disruption of this community—by toxic shock, oxygen failure, or filamentous bulking—degrades settling and allows solids to escape in the effluent. Understanding the floc as an ecosystem rather than a particle is the conceptual shift that separates rote learning from genuine comprehension of biological treatment.
Preparing for BOD Measurement and the Next Lesson
This lesson has traced sewage from its raw composition through primary physical separation, secondary biological oxidation, sludge settling, anaerobic digestion, and tertiary polishing. The unifying thread is microbial labour: floc-forming bacteria consume dissolved organics, protozoa clarify the effluent, and methanogens convert sludge into biogas. The plant is a managed ecosystem, and its performance depends on maintaining the conditions under which these organisms thrive. The next lesson turns to the measurement that governs the entire process, examining the BOD test in detail, including its five-day incubation, its assumptions, and its limitations.
Before moving on, consolidate the key relationships. Primary treatment removes solids and a modest fraction of BOD but does not disinfect. Secondary treatment removes the bulk of dissolved organics and reduces BOD by 85–95 per cent, producing activated sludge that is partly recycled and partly digested. Anaerobic digestion stabilises sludge and yields biogas. Tertiary treatment removes nutrients and inactivates pathogens. Each stage has a distinct mechanism, a distinct microbial or physical agent, and a distinct role in protecting public health and the environment. Mastery of this sequence is the foundation for understanding pollution measurement and advanced treatment design.
A visit to a sewage treatment plant situated near you would be a very interesting and educating experience, as the reference material suggests. Seeing the screens, the grit chambers, the churning aeration tanks, and the settling clarifiers brings the abstractions to life. Watching the colour and clarity of the effluent change from stage to stage, and smelling the difference between raw sewage and treated effluent, teaches more than any diagram. If you can, observe the return sludge pump and the digester gas flare; these are the visible signatures of the microbial processes described here.
Also Read
- No links available.
From our network :
- Analyzing Trump Deportation Numbers Insights Into The 2026 Immigration Crackdown
- 10 Physics Numerical Problems with Solutions for IIT JEEPrepare for IIT JEE with 10 physics numerical problems, complete with detailed solutions and conceptual explanations. Ideal for mastering kinematics, thermodynamics, electromagnetism, and optics.
- AI-Powered 'Precision Diagnostic' Replaces Standard GRE Score ReportsDiscover the new GRE Precision Diagnostic. Learn how AI-powered behavioral analytics and time-to-solve tracking are replacing standard GRE score reports to empower students.
- Where to Put Your Wireless Router for Better CoverageA practical, physics-grounded guide to router placement: why the centre of the home beats the corner, how walls and metal sap signal, and how to run a simple survey that proves the improvement.
- How to Print Cheaply: Cutting the Cost per PageA practical, measured guide to lowering what each printed page costs — duplex and draft modes, third-party ink, yield mathematics, and knowing when a new printer beats refills.
- Do You Need a New Router or Is Your Internet Plan the Problem?A practical comparison of the signs that point to router limits versus signs your broadband speed or provider is the bottleneck, so you can decide what to replace before spending money.
- 98% of Global MBA Programs Now Prefer GRE Over GMAT Focus EditionExplore why 98% of global MBA programs now prefer the GRE over GMAT Focus. Learn about the shorter GRE format, verbal logic importance, and strategic versatility for students.
- EV 2.0: The Solid-State Battery Breakthrough and Global Factory ExpansionDiscover the impact of the Solid-State Battery Breakthrough on the EV market. Learn about CATL and BYD stock growth, global factory expansion in Europe, and the future of EV 2.0 technology.
- Trump Political Strategy How Geopolitical Stunts Serve As Media Diversions
RESOURCES
- Resources will be updated soon.