Mendel's garden peas rewarded him with clean, binary answers: a flower was purple or white, a seed round or wrinkled, and every ratio fell neatly into halves and quarters. Real organisms are rarely so obliging. Walk through any crowded street and you will see a continuous spectrum of heights, skin tones, and body builds, none of which sort themselves into two tidy classes. This lesson confronts that complexity directly, examining the two mirror-image phenomena that classical genetics struggled longest to explain: polygenic inheritance, in which many genes cooperate to shape one trait, and pleiotropy, in which a single gene reaches out to influence many traits at once.

These two concepts sit at the heart of Lesson 6 in our course on the principles of inheritance and variation, and they mark a genuine turning point in the sequence. Having established in the previous lesson how chromosomes carry linked genes and how crossing over shuffles them, we now ask what happens when the arithmetic of inheritance involves dozens of loci rather than one. The answer reshapes how biologists think about human disease, agricultural breeding, and the very meaning of a "gene for" a trait. By the end, you will be able to model a polygenic trait quantitatively, explain why phenylketonuria produces both intellectual disability and pale pigmentation from a single mutation, and recognise where epistasis complicates the picture further.
The material ahead builds deliberately on what you already know about segregation, independent assortment, and linkage, and it prepares the ground for the chromosomal mechanisms of sex determination that follow. Expect worked genetic models, a discussion of quantitative trait loci and their mapping, the distinction between continuous and discontinuous variation, and a careful treatment of environmental influence through the concept of the reaction norm. Each section pairs the textbook account with the reasoning behind it, so that the definitions stick because you understand why they are framed as they are.
On This Page
- From Discrete Classes to Continuous Gradients
- Modelling Polygenic Inheritance with Additive Alleles
- Quantitative Trait Loci and the Mapping of Complex Traits
- Pleiotropy: One Gene, Many Phenotypes
- Environment, Reaction Norms, and the Heritability Question
- Epistasis and the Wider Architecture of Trait Control
- Common Misconceptions and Examination Pitfalls
- Computational Approaches to Polygenic Traits
- Consolidating the Lesson and Looking Ahead
From Discrete Classes to Continuous Gradients
Mendel's studies mainly described those traits that have distinct alternate forms, such as flower colour, which is either purple or white. Look around, however, and you will find many traits that are not so distinct in their occurrence and are spread across a gradient. In humans we do not simply have tall or short people as two alternatives but a whole range of possible heights. Such traits are generally controlled by three or more genes and are thus called polygenic traits. Recognising this distinction is the first step toward understanding why some inherited characteristics resist the tidy ratios that pea plants made famous.
Continuous Versus Discontinuous Variation
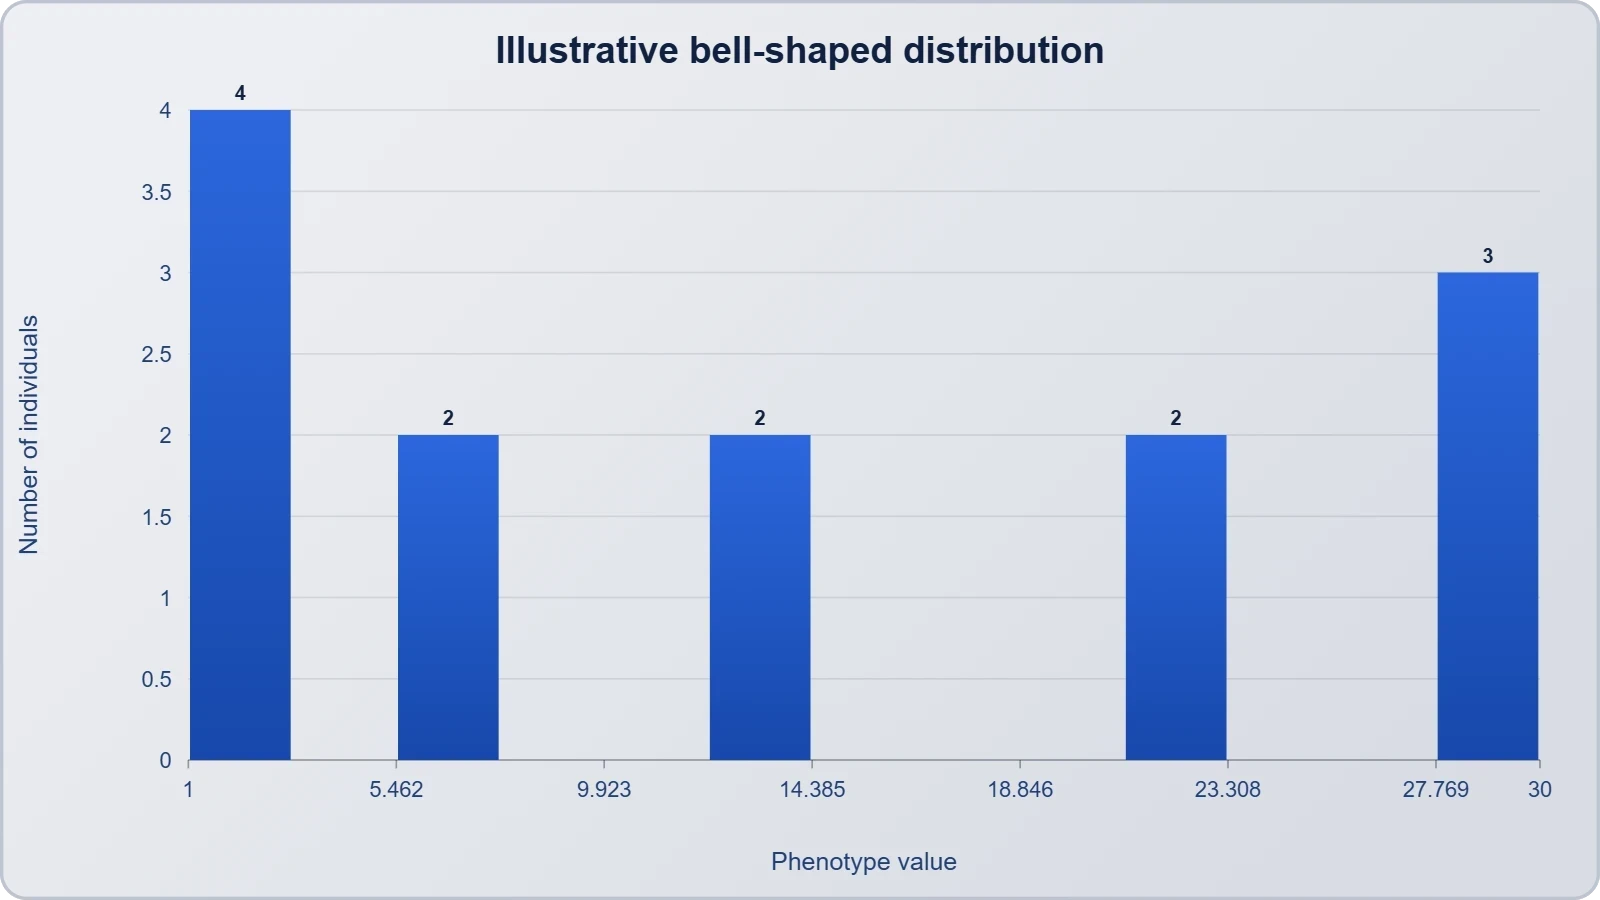
Discontinuous variation produces phenotypes that fall into separate, non-overlapping categories. Blood groups are the classic illustration: a person is A, B, AB, or O, and no intermediate exists between them. Continuous variation, by contrast, produces a smooth distribution of phenotypes with no sharp boundaries, and when you plot the measurements of a large population you typically obtain a bell-shaped normal curve. Height, weight, skin colour, and grain yield in crops all behave this way. The underlying reason is that many genes, each contributing a small increment, combine additively, and the environment adds further fine-tuning, blurring any categorical edges.
The statistical signature of continuous variation is worth noting because it guides breeders and geneticists alike. When numerous independent loci each add a small effect, the central limit theorem pushes the distribution toward normality, with most individuals clustering near the mean and extremes becoming rare. This is precisely why extremely tall or extremely short people are uncommon, and why the children of two very tall parents tend to be tall but usually less extreme than their parents. That regression toward the mean, first documented by Francis Galton in the nineteenth century, is a direct consequence of polygenic architecture combined with environmental noise.
Why Mendel Missed Polygenic Traits
Mendel chose his experimental traits wisely, perhaps without fully realising it. Pea flower colour, seed shape, and pod colour are each governed by one or a few major loci with clear dominance, so the phenotypes segregated cleanly and the ratios were legible. Had he chosen plant height in a wild population, or seed weight, he would have confronted continuous distributions that no simple 3:1 ratio could capture. The lesson is methodological as much as biological: the choice of trait determines the visibility of the underlying genetic architecture, and discrete traits reveal Mendelian ratios while quantitative traits conceal them beneath a fog of small additive effects.
This historical accident shaped genetics for decades. Early twentieth-century Mendelians and biometricians feuded bitterly, the former insisting on discrete factors and the latter on continuous inheritance, until Ronald Fisher's 1918 paper demonstrated mathematically that many Mendelian factors of small effect, acting additively, generate exactly the continuous distributions the biometricians measured. Fisher's reconciliation established that there is no contradiction between particulate genes and continuous traits; the two are simply different scales of the same phenomenon. Modern quantitative genetics descends directly from that insight.
Modelling Polygenic Inheritance with Additive Alleles
Human skin colour is a classic example of polygenic inheritance. In a polygenic trait the phenotype reflects the contribution of each allele; that is, the effect of each allele is additive. To understand this, assume that three genes, A, B, and C, control skin colour in humans, with the dominant forms A, B, and C responsible for dark skin colour and the recessive forms a, b, and c for light skin colour. The genotype with all the dominant alleles (AABBCC) will have the darkest skin colour, and that with all the recessive alleles (aabbcc) will have the lightest. As expected, a genotype with three dominant and three recessive alleles will have an intermediate skin colour. In this manner the number of each type of allele in the genotype determines the darkness or lightness of skin in an individual.
A Worked Three-Gene Model
Consider a cross between two individuals of intermediate genotype, AaBbCc, each carrying three dark-contributing alleles. Because the three loci assort independently, each parent produces gametes with a variable number of contributing alleles, and the offspring distribution follows the binomial expansion of ##(1/2 + 1/2)^6##, since six allele positions are inherited in total. The number of dark alleles in an offspring can range from zero to six, and the frequencies follow the coefficients 1, 6, 15, 20, 15, 6, 1 out of 64. The most common phenotype is therefore the intermediate one with three contributing alleles, and the extremes are rare, occurring once in sixty-four each.
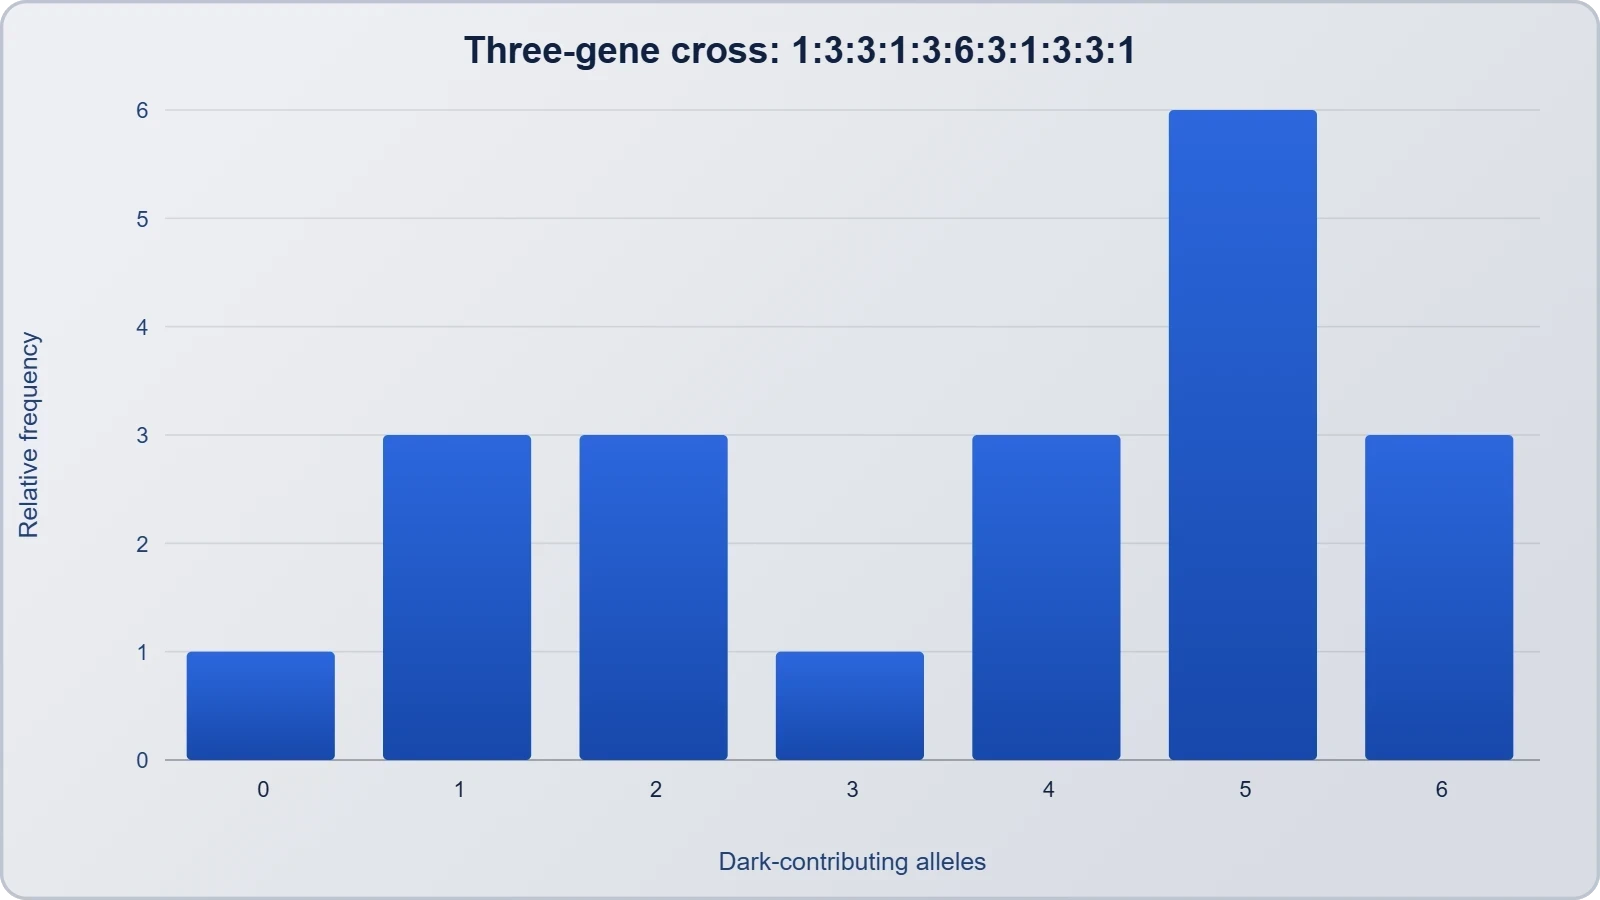
Here ##k## represents the number of dark-contributing alleles and ##P(k)## the probability of that class. The formula makes the additive logic explicit: each allele contributes one unit of pigmentation, and the phenotype is simply the sum. This is why the distribution is symmetric and bell-shaped even though the underlying inheritance is strictly Mendelian. A two-gene model, by contrast, yields only five phenotypic classes in a 1:4:6:4:1 ratio out of sixteen, which is easier to work through by hand and is a common examination exercise.
Reading the Ratios and Their Limits
Students often ask why the 1:4:6:4:1 ratio for two genes looks nothing like the familiar 9:3:3:1. The answer lies in what is being counted. The 9:3:3:1 ratio classifies offspring by genotype at each locus separately, distinguishing dominant from recessive phenotypes. The polygenic ratio instead collapses all genotypes with the same total number of contributing alleles into a single phenotypic class, because the alleles are additive rather than dominant. Two genotypes as different as AABb and AaBB both carry three contributing alleles and are therefore phenotypically identical in this model.
Real polygenic traits rarely conform perfectly to such clean models. The number of loci is usually larger than three, the alleles are not strictly equal in effect, dominance is often partial rather than absent, and environmental variation adds scatter around each genotypic value. The model is therefore a simplification, but a powerful one: it captures the essential logic of additive inheritance and predicts the qualitative features, such as a normal distribution and regression toward the mean, that real data display. Treat the ratios as a conceptual scaffold rather than a literal prediction for any particular human trait.
Quantitative Trait Loci and the Mapping of Complex Traits
The genes that underlie continuous traits are called quantitative trait loci, or QTLs. A QTL is simply a chromosomal region, identified statistically rather than by eye, that harbours one or more genes influencing a measurable trait. Because individual QTL effects are typically small, they cannot be tracked by following a single visible marker the way Mendel followed flower colour. Instead, geneticists cross two strains that differ in the trait, genotype a large progeny population with molecular markers spaced across the genome, and then test whether the trait value correlates with the inheritance of particular marker alleles. A strong correlation flags a region likely to contain a contributing gene.
How QTL Mapping Works in Practice
The statistical engine of QTL mapping is the comparison of trait means across marker genotype classes. If offspring inheriting marker allele M1 from one parent consistently show higher trait values than those inheriting M2, the marker is linked to a locus affecting the trait. The strength of the association is expressed as a logarithm of odds score, and a peak above a significance threshold identifies the QTL interval. Modern studies use dense single-nucleotide polymorphism maps and thousands of individuals, and the approach has been applied to grain yield in rice, flowering time in Arabidopsis, and body mass in mice.
QTL mapping has real limitations that students should appreciate. The resolution depends on the number of recombination events in the mapping population, so confidence intervals often span many genes, and identifying the causal gene within a QTL requires follow-up work such as fine mapping, expression analysis, or genome editing. Furthermore, a QTL detected in one cross may not appear in another because the relevant alleles differ between parental strains. Despite these caveats, QTL analysis remains the bridge between classical polygenic theory and modern genomics, and it underpins much of contemporary plant and animal breeding.
From QTLs to Genome-Wide Association Studies
An alternative strategy abandons controlled crosses and surveys natural populations instead. Genome-wide association studies compare the frequencies of millions of genetic variants between individuals with and without a trait, or correlate variant dosage with a quantitative measurement. This approach can achieve finer resolution because historical recombination has broken the genome into small blocks, but it demands very large samples and careful correction for population structure. For human height, association studies have identified thousands of variants, each contributing a fraction of a centimetre, which beautifully confirms the polygenic model while showing how much more complex real traits are than three-gene textbook examples.
The cumulative picture from these studies is instructive. For most complex traits, a modest number of loci with relatively larger effects coexist with a long tail of variants of tiny effect, and the total heritability is distributed across all of them. This architecture explains why predicting a complex trait from genotype alone remains difficult, and why the environment retains substantial influence. It also explains why the search for single "genes for" height or intelligence is misguided: the trait emerges from the aggregate, not from any one locus acting alone.
Pleiotropy: One Gene, Many Phenotypes
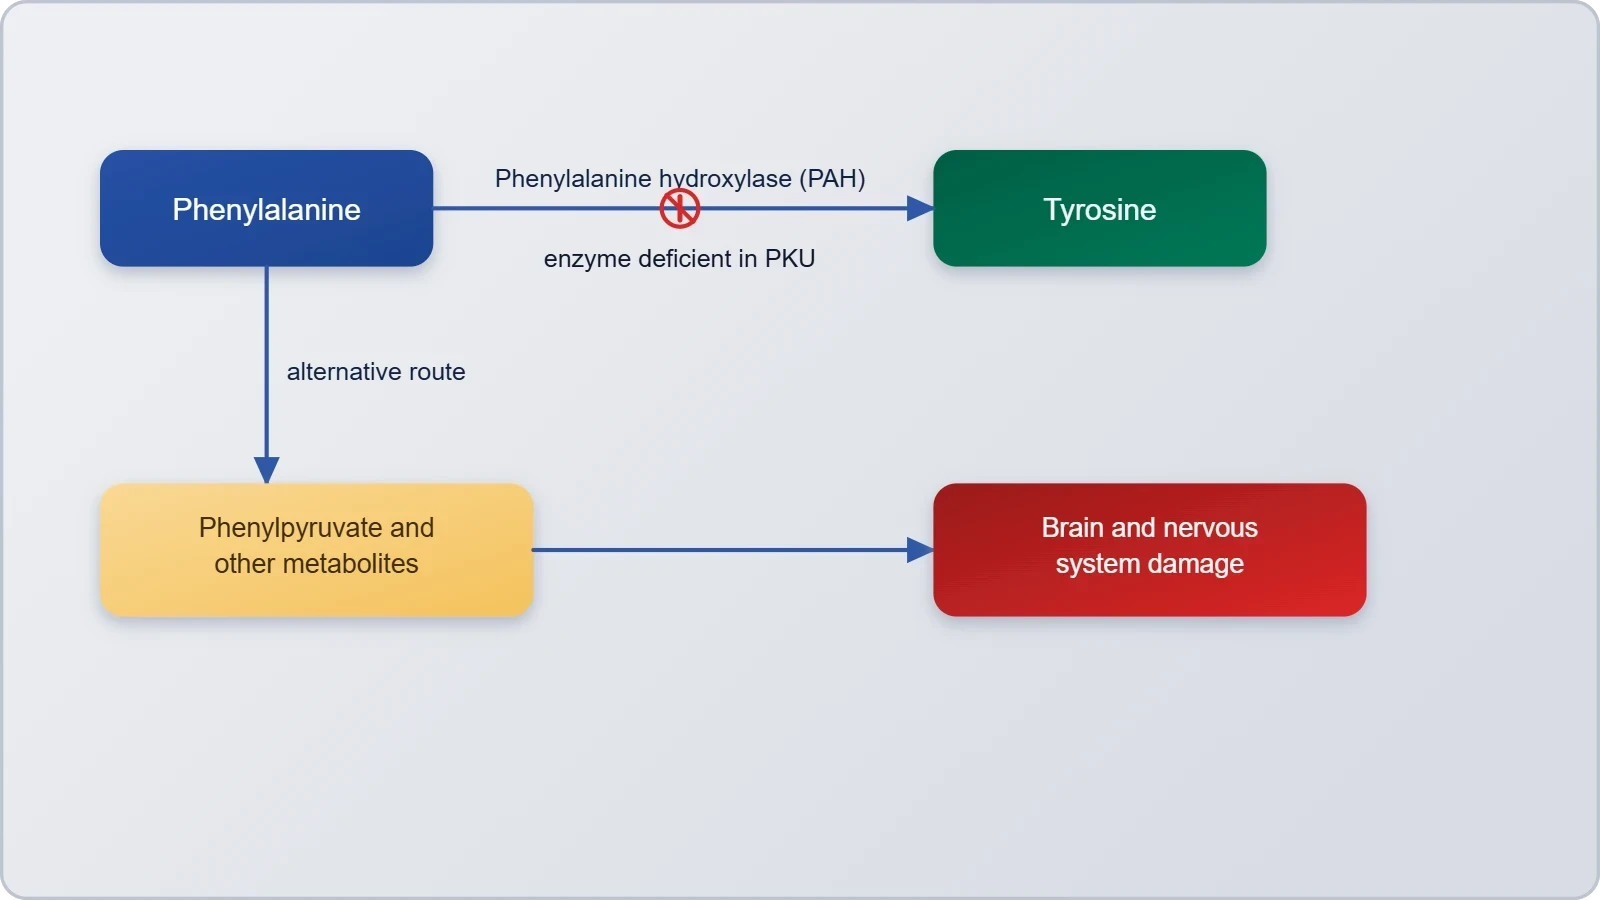
We have so far seen the effect of a gene on a single phenotype or trait. There are, however, instances where a single gene can exhibit multiple phenotypic expressions, and such a gene is called a pleiotropic gene. The underlying mechanism of pleiotropy in most cases is the effect of a gene on metabolic pathways that contribute toward different phenotypes. An example is the disease phenylketonuria, which occurs in humans. The disease is caused by a mutation in the gene that codes for the enzyme phenylalanine hydroxylase, a single gene mutation, and it manifests through phenotypic expression characterised by mental retardation and a reduction in hair and skin pigmentation.
Phenylketonuria as a Model of Pleiotropy
The logic of phenylketonuria, commonly abbreviated PKU, repays close attention. Phenylalanine hydroxylase normally converts the amino acid phenylalanine into tyrosine, which is itself the precursor of melanin, the pigment responsible for hair and skin colour. When the enzyme is defective, phenylalanine accumulates to toxic levels in the blood and brain, impairing neurological development, while tyrosine becomes scarce, so pigment synthesis falls. One mutation therefore produces two apparently unrelated consequences, intellectual disability and pale colouring, because the single enzyme sits at a branch point in a shared metabolic pathway. This is pleiotropy explained through biochemistry rather than coincidence.
The clinical history of PKU also illustrates how genetic understanding translates into public health. Newborn screening programmes measure phenylalanine levels in a heel-prick blood sample within days of birth, and affected infants are placed on a diet restricted in phenylalanine. When treatment begins early, intellectual disability is largely prevented, even though the underlying mutation persists. The pale pigmentation remains, a permanent reminder of the blocked pathway. PKU thus demonstrates that a pleiotropic gene can produce some effects that are modifiable by environment and others that are not, a nuance that matters enormously in genetic counselling.
Mechanisms and Further Examples
Pleiotropy can arise in at least two distinct ways. First, a single gene product may participate in several biochemical pathways, as with phenylalanine hydroxylase, so its loss disrupts each pathway independently. Second, a gene may be expressed in multiple tissues during development, so a mutation affects every tissue in which the product is required. Many developmental regulatory genes fall into this second category, which is why mutations in them often produce syndromes, collections of seemingly unrelated abnormalities, rather than single isolated defects. Marfan syndrome, caused by mutations in the fibrillin gene, affects the skeleton, eyes, and cardiovascular system simultaneously for precisely this reason.
Other well-known examples reinforce the pattern. The gene responsible for sickle cell anaemia alters haemoglobin structure, which in turn affects red blood cell shape, oxygen transport, spleen function, and resistance to malaria, a striking case of one variant with many consequences. In plants, the same gene may influence flower colour, seed coat, and stress tolerance. The practical implication for geneticists is that a mutation should never be assumed to have a single effect; careful phenotypic description across many organ systems is essential, and the search for a "one gene, one trait" relationship is a useful simplification rather than a biological law.
Environment, Reaction Norms, and the Heritability Question
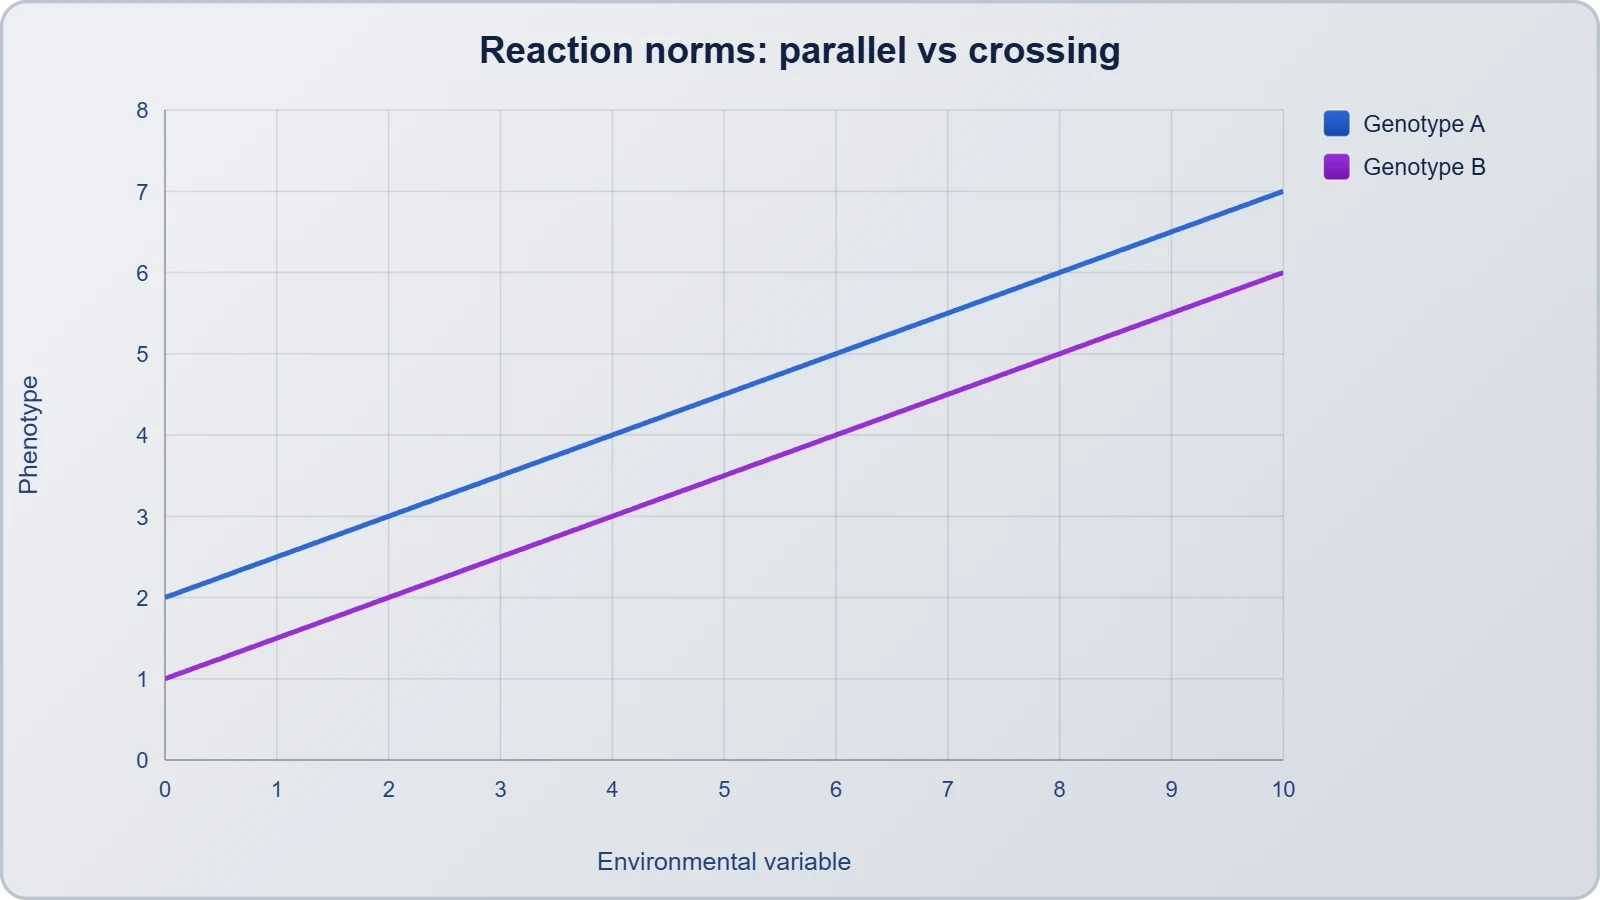
Besides the involvement of multiple genes, polygenic inheritance also takes into account the influence of environment. Human skin colour illustrates this well: genetic background sets a range, but sun exposure shifts the actual pigmentation within that range. The same logic applies to height, where nutrition, childhood illness, and sleep all modulate the final stature a genotype can achieve. The concept that captures this interplay is the reaction norm, defined as the range of phenotypes a single genotype can produce across different environments. A flat reaction norm means the trait is insensitive to environment; a steep one means the same genotype yields very different outcomes depending on conditions.
Reaction Norms and Phenotypic Plasticity
Reaction norms are best visualised as curves plotting phenotype against an environmental variable for each genotype. If the curves for different genotypes are parallel, the environment shifts everyone equally and genetic differences remain constant. If the curves cross, the ranking of genotypes changes with environment, a phenomenon called genotype-by-environment interaction. Plant breeders confront this constantly: a wheat variety that yields best in irrigated fields may perform poorly in drought, so recommendations must be matched to local conditions. The reaction norm concept thus converts the vague phrase "nature and nurture" into something measurable and predictive.
Phenotypic plasticity, the capacity of a single genotype to express different phenotypes, is the organism-level manifestation of the reaction norm. It is not a failure of genetic determination but an evolved property in its own right, often adaptive. Human skin tanning is a plastic response that protects against ultraviolet damage, and the ability to acclimatise to high altitude involves plastic changes in red blood cell production. Recognising plasticity prevents the common error of assuming that a heritable trait must be fixed, and it explains why identical twins, despite sharing a genome, diverge in measurable ways as they age.
Heritability and Its Misinterpretations
Heritability is the proportion of phenotypic variance in a population attributable to genetic variance, and it is routinely misunderstood. A heritability of 0.8 for height does not mean that eighty per cent of any individual's height is genetic; it means that, in the population studied, eighty per cent of the observed variation is associated with genetic differences. Heritability is a property of populations and environments, not of individuals, and it can change if the environment changes. In a uniformly well-nourished population, genetic differences account for more of the remaining height variation, so heritability estimates rise, which is exactly what comparisons across countries have shown.
The practical corollary is that high heritability does not imply immutability. Myopia is highly heritable, yet its prevalence has risen sharply in populations that adopted intensive near-work and reduced outdoor time, showing that environmental change can shift a trait even when genes matter greatly. For polygenic traits, the sensible framing is that genes set propensities and environments determine where within the reaction norm an individual lands. This balanced view is essential for interpreting studies of height, body mass, educational attainment, and disease risk, and it guards against both genetic determinism and the naive dismissal of heredity.
Epistasis and the Wider Architecture of Trait Control
Polygenic inheritance assumes that alleles at different loci combine additively, each contributing its own increment. Epistasis breaks that assumption: one gene masks or modifies the effect of another, so the combined phenotype is not the simple sum of individual effects. The classic example comes from coat colour in Labrador retrievers, where one locus determines whether pigment is black or brown and a second locus determines whether pigment is deposited at all. A dog homozygous for the non-depositing allele is golden regardless of its genotype at the colour locus, because the second gene overrides the first. The interaction, not the individual genes, dictates the outcome.
Types of Epistatic Interaction
Epistasis takes several recognisable forms, each with a characteristic modification of the dihybrid ratio. In recessive epistasis, homozygosity for a recessive allele at one locus masks the other locus, converting the 9:3:3:1 ratio into 9:3:4. In dominant epistasis, a single dominant allele at one locus suppresses the other, yielding 12:3:1. In complementary gene action, both loci must carry at least one dominant allele for the trait to appear, giving 9:7. These ratios are diagnostic signatures, and recognising them allows a geneticist to infer the underlying interaction from phenotypic counts alone, a skill worth practising with worked examples.
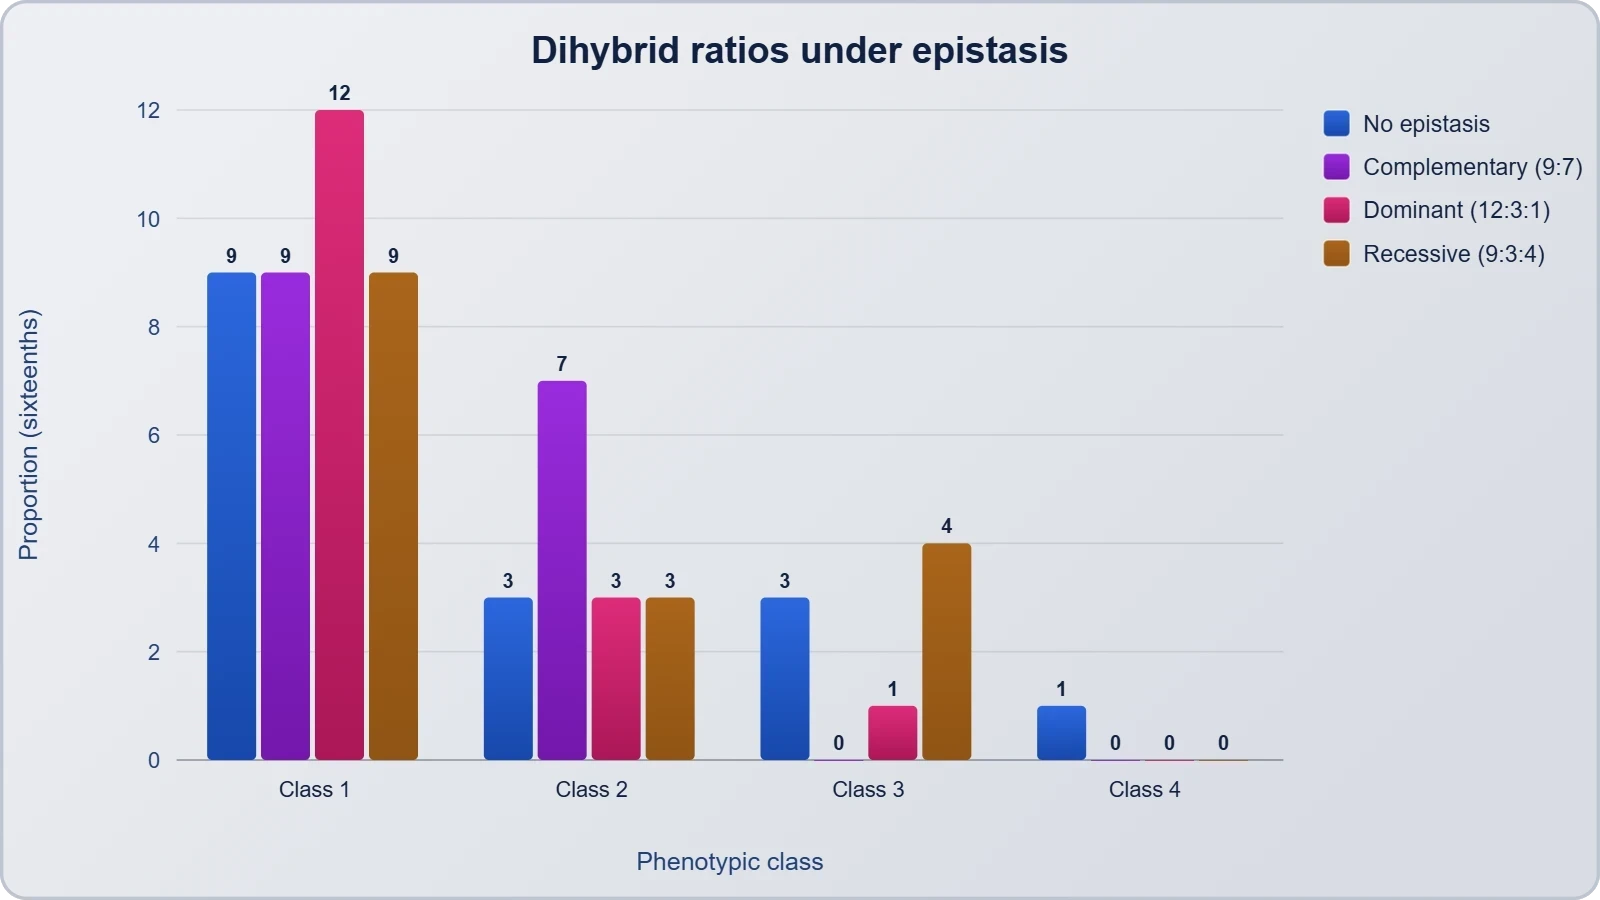
Epistasis matters far beyond textbook ratios. It shapes the response of populations to selection, because the fitness effect of an allele depends on the genetic background in which it sits. It complicates genome-wide association studies, since the effect of a variant may differ depending on variants at other loci, and it explains why some individuals carrying a disease-associated allele remain healthy. In agricultural genetics, exploiting favourable epistatic combinations through careful crossing can produce hybrids that outperform either parent, a phenomenon known as heterosis or hybrid vigour, which underpins much of modern crop production.
Integrating Polygenic Inheritance, Pleiotropy, and Epistasis
These three concepts are best understood as complementary lenses on the same underlying reality: genes do not act in isolation. Polygenic inheritance describes many genes converging on one trait; pleiotropy describes one gene radiating to many traits; epistasis describes genes modifying one another's effects. A single organism exhibits all three simultaneously. Human height, for instance, is polygenic, influenced by environment, subject to epistatic interactions among variants, and entangled with pleiotropic genes that also affect cancer risk or skeletal development. The network, not the single gene, is the appropriate unit of explanation.
This integrated view has practical consequences for medicine and agriculture. Drug responses often depend on multiple genes acting in concert, so pharmacogenomics must consider polygenic risk scores rather than single variants. Crop improvement must balance yield, which is polygenic, against disease resistance, which may involve pleiotropic trade-offs, while accounting for epistatic interactions that determine whether a favourable allele actually delivers its benefit. The lesson for students is to hold all three concepts together, because the biology they describe is inseparable, and to resist the temptation to reduce complex traits to single causal factors.
Common Misconceptions and Examination Pitfalls
Several errors recur whenever polygenic inheritance and pleiotropy are examined, and naming them explicitly helps students avoid them. The first is the belief that polygenic traits are not Mendelian. They are entirely Mendelian; each contributing locus segregates and assorts according to Mendel's laws, and the continuous distribution emerges from the summation of many small Mendelian effects. The second is the assumption that a polygenic trait has no major genes. In reality, some loci contribute substantially more than others, which is why QTL studies can detect peaks of large effect even in highly polygenic traits.
Distinguishing Pleiotropy from Polygeny and Linkage
Students frequently confuse pleiotropy with polygenic inheritance because both involve multiple phenotypic observations. The distinction is directional. In polygeny, many genes influence one trait; in pleiotropy, one gene influences many traits. A related confusion arises with linkage, where two genes sit close together on a chromosome and are inherited together, producing correlated phenotypes that can mimic pleiotropy. The test is whether the correlation persists when the genes are separated by recombination. If it does, the single-gene explanation of pleiotropy holds; if it breaks down, linkage was the cause. Careful genetic mapping resolves the ambiguity.
Another pitfall is treating pleiotropy as evidence that a gene is "for" several unrelated things. The gene has one biochemical function, and the multiple phenotypes are downstream consequences of that function operating in different contexts. Phenylalanine hydroxylase does not have a "mental development gene" function and a "pigment gene" function; it has one catalytic role whose failure ripples through two pathways. Framing pleiotropy this way keeps the molecular logic clear and prevents the teleological language that often creeps into student answers.
Practical Advice for Problem Solving
When confronted with a genetics problem, first classify the trait: is it discrete or continuous, and how many loci appear to be involved? If the data show a continuous distribution, suspect polygenic inheritance and consider whether the number of phenotypic classes suggests a specific number of gene pairs. If a single mutation produces several distinct abnormalities, suspect pleiotropy and trace the metabolic pathway. If two loci interact to modify a single trait, check whether the ratio matches an epistatic signature. This decision tree converts vague recall into a reliable analytical procedure.
Numerical problems deserve particular care. For additive polygenic crosses, remember that the number of phenotypic classes equals ##2n + 1## for ##n## gene pairs, and the frequencies follow binomial coefficients. For a cross between an extreme homozygote and another extreme, all offspring are intermediate, and subsequent generations segregate widely. Always state your assumptions about independent assortment and equal allelic effects, because examiners award marks for recognising when a model applies and when it does not. Finally, sanity-check your answer against the expected distribution shape; a symmetric bell curve is the hallmark of additive polygeny.
Computational Approaches to Polygenic Traits
Modern analysis of polygenic traits relies heavily on computation, and a brief exposure to the methods deepens understanding of the concepts. A polygenic risk score, for instance, sums the effects of many variants weighted by their estimated effect sizes, producing a single number that estimates an individual's genetic propensity for a trait. The underlying arithmetic is simple addition, but the statistical machinery that estimates the weights is sophisticated. The code below illustrates the core calculation in a compact form, showing how individual allele dosages are multiplied by their effect sizes and accumulated.
A Minimal Polygenic Score Implementation
The snippet below takes a dictionary of variant effect sizes and a dictionary of an individual's genotype dosages, then computes the weighted sum. In practice, scores are standardised against a reference population and validated in independent cohorts, but the essential logic is captured here. Reading such code helps students see that polygenic inheritance is not merely a qualitative idea; it is a quantitative model that can be implemented, tested, and refined with real genomic data.
def polygenic_score(effect_sizes, dosages):
    """Compute a simple additive polygenic score."""
    score = 0.0
    for variant, beta in effect_sizes.items():
        dosage = dosages.get(variant, 0)
        score += beta * dosage
    return score

effects = {"rs1": 0.12, "rs2": -0.08, "rs3": 0.05}
genotypes = {"rs1": 2, "rs2": 1, "rs3": 0}

print(polygenic_score(effects, genotypes))
Interpreting Scores Responsibly
Polygenic scores are powerful but easy to overinterpret. They describe relative genetic propensity within a population, not destiny for an individual, and their predictive accuracy often differs across ancestries because the underlying studies have historically sampled unevenly. A high score for a disease raises risk but does not guarantee onset, and a low score does not confer immunity. Responsible use requires communicating uncertainty, avoiding deterministic claims, and remembering that environment and chance remain substantial contributors. The computational elegance of the score should never obscure the biological and ethical complexity behind it.
For students progressing to university study, familiarity with these methods is increasingly valuable. The same additive logic that underlies a three-gene skin colour model scales directly to thousands of variants in a genome-wide score, and the statistical concepts of variance, heritability, and effect size recur throughout quantitative genetics. Mastering the simple model now provides the intuition needed to interpret complex genomic studies later, and it reinforces the central theme of this lesson: inheritance is a quantitative, interactive, and environmentally contingent phenomenon.
Consolidating the Lesson and Looking Ahead
The journey through this lesson has moved from the limitations of Mendel's discrete traits to the quantitative architecture of polygenic inheritance, then to the radiating effects of pleiotropic genes, and finally to the interactions captured by epistasis and the modulating role of environment. Each concept refines the picture of how traits are transmitted and how variation arises. The additive model of skin colour, the metabolic cascade of phenylketonuria, the diagnostic ratios of epistasis, and the reaction norm all illustrate the same principle from different angles: genes act within networks and contexts, not as isolated determinants.
Key Takeaways for Revision
For revision, anchor your understanding in a few core statements. Polygenic traits are controlled by three or more genes with additive effects, producing continuous variation and normal distributions. Pleiotropy occurs when one gene affects multiple phenotypes, often through a shared metabolic pathway. Epistasis describes one gene masking or modifying another, generating characteristic ratio modifications. Environment shapes polygenic traits through reaction norms, and heritability measures population variance rather than individual destiny. QTL mapping and genome-wide association studies connect these classical concepts to modern genomics, while polygenic scores translate them into computational tools.
Practise applying these ideas to unfamiliar examples. If a plant breeder reports a continuous distribution of oil content, suspect polygeny and consider QTL analysis. If a single mutation causes both neurological and pigmentary abnormalities, trace the metabolic pathway to confirm pleiotropy. If a dihybrid cross yields a 9:7 ratio, recognise complementary gene action. This habit of classification, grounded in mechanism rather than memorisation, is what distinguishes genuine understanding from surface recall and will serve you well in competitive examinations and university coursework alike.
Preparing for Sex Determination
The next lesson turns to sex determination, examining the chromosomal mechanisms that assign an organism to male or female developmental pathways. The groundwork laid here will prove useful: the distinction between autosomes and sex chromosomes, the concept of heterogamety, and the logic of chromosomal segregation all build on the principles of inheritance and variation developed across this course. Having seen how multiple genes can shape one trait and how one gene can shape many, you are well prepared to appreciate how a single chromosomal difference can cascade into an entire suite of sexually dimorphic characteristics.
Before moving on, consolidate your notes on the three central concepts of this lesson and test yourself with the worked ratios. Try constructing a three-gene cross from first principles, predicting the phenotypic distribution, and then verifying it with the binomial formula. Attempt to explain phenylketonuria to a classmate without using the word "gene" more than once, focusing instead on the enzyme and the pathway. These exercises cement the material far more effectively than rereading, and they prepare you for the chromosomal mechanisms that lie ahead in Lesson 7.
Also Read
- No links available.
From our network :
- EV 2.0: The Solid-State Battery Breakthrough and Global Factory ExpansionDiscover the impact of the Solid-State Battery Breakthrough on the EV market. Learn about CATL and BYD stock growth, global factory expansion in Europe, and the future of EV 2.0 technology.
- 10 Physics Numerical Problems with Solutions for IIT JEEPrepare for IIT JEE with 10 physics numerical problems, complete with detailed solutions and conceptual explanations. Ideal for mastering kinematics, thermodynamics, electromagnetism, and optics.
- Analyzing Trump Deportation Numbers Insights Into The 2026 Immigration Crackdown
- How to Print Cheaply: Cutting the Cost per PageA practical, measured guide to lowering what each printed page costs — duplex and draft modes, third-party ink, yield mathematics, and knowing when a new printer beats refills.
- Trump Political Strategy How Geopolitical Stunts Serve As Media Diversions
- AI-Powered 'Precision Diagnostic' Replaces Standard GRE Score ReportsDiscover the new GRE Precision Diagnostic. Learn how AI-powered behavioral analytics and time-to-solve tracking are replacing standard GRE score reports to empower students.
- 98% of Global MBA Programs Now Prefer GRE Over GMAT Focus EditionExplore why 98% of global MBA programs now prefer the GRE over GMAT Focus. Learn about the shorter GRE format, verbal logic importance, and strategic versatility for students.
- Where to Put Your Wireless Router for Better CoverageA practical, physics-grounded guide to router placement: why the centre of the home beats the corner, how walls and metal sap signal, and how to run a simple survey that proves the improvement.
- Do You Need a New Router or Is Your Internet Plan the Problem?A practical comparison of the signs that point to router limits versus signs your broadband speed or provider is the bottleneck, so you can decide what to replace before spending money.
RESOURCES
- 6.4: Pleiotropy vs. Polygenic Inheritance - Biology LibreTextsbio.libretexts.orgMar 2, 2024 ... Pleiotropy occurs when one gene influences two or more seemingly unrelated phenotypic traits. Such a gene that exhibits multiple phenotypic ...
- Pleiotropy: One Gene Can Affect Multiple Traits - Naturenature.comQuite simply, pleiotropy reflects the fact that most proteins have multiple roles in distinct cell types; thus, any genetic change that alters gene expression ...
- Pleiotropy vs Polygenic Inheritance | BioRender Science Templatesbiorender.comCompare pleiotropy seen in sickle cell disease with polygenic inheritance of human height variation. A free, accurate, and fully editable diagram.
- LibreCommons | non-mendelian inheritance - pleiotropy & polygenic ...studio.libretexts.orgPleiotropy is when one gene affects multiple characteristics (e.g. Marfan syndrome). Polygenic inheritance is when one trait is controlled by one gene (e.g. ...
- Disentangling selection on genetically correlated polygenic traits via ...pubmed.ncbi.nlm.nih.govFeb 4, 2021 ... The method can quantify selection acting on correlated traits, controlling for pleiotropy even among traits with strong genetic correlation (|rg ...
- Epistasis: Gene Interaction & Dominance Flashcards - Quizletquizlet.comPleiotropy refers to a single gene that affects multiple traits. Polygenic inheritance refers to a single gene that affects multiple traits. Pleiotropy ...
- What is the difference between pleiotropy and polygenic inheritance?quora.comApr 15, 2016 ... ... between pleiotropy and polygenic inheritance? All related (44). Recommended. Profile photo for Assistant. Assistant. Bot. · 1y.
- Analyze pleiotropy and polygenic inheritance concepts - Varsity Tutorsvarsitytutors.comPleiotropy occurs when a single gene influences multiple traits, as seen in conditions like sickle cell anemia, Marfan syndrome, and PKU. In contrast, polygenic ...
- Pleiotropy and Polygenic Inheritance Not all traits are controlled by a ...facebook.comAug 13, 2026 ... Pleiotropy and polygenic inheritance show two different ways genes can influence multiple or complex traits. Pleiotropy Pleiotropy occurs ...
- Differentiate between pleiotropy and polygenic inheritance. - Vedantuvedantu.comThe ability of a gene to influence more than one trait is called pleiotropy whereas in polygenic inheritance the inheritance is influenced by a…
- Pleiotropy and Polygenic Inheritance Not every trait follows the ...facebook.comAug 15, 2026 ... Pleiotropy and polygenic inheritance show how genes can produce much more complex patterns of inheritance. Pleiotropy Pleiotropy occurs when ...
- Which of the statements accurately describes both pleiotropy and ...chegg.comJun 9, 2024 ... Therefore, the correct statement would be: Polygenic inheritance refers to the combined effect of multiple genes on a single trait,…
- Understanding Epistasis, Pleiotropy, and Polygenic Inheritance in ...alperbulbul.coWhile epistasis involves multiple genes determining a single phenotype, pleiotropy involves a single gene influencing multiple phenotypic traits. Together with ...
- Pleiotropy, epistasis and the genetic architecture of quantitative traitspmc.ncbi.nlm.nih.govApr 2, 2024 ... Pleiotropy (whereby one genetic polymorphism affects multiple traits) and epistasis (whereby non-linear interactions between genetic ...