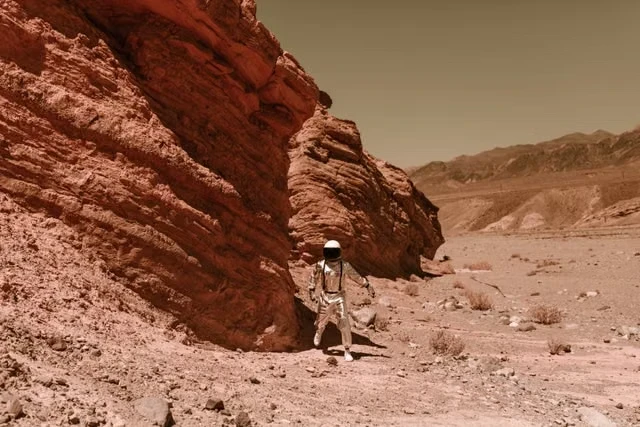
For decades, humanity’s understanding of Mars has been mediated through flat, static imagery—orbital photographs, rover panoramas, and colorized elevation maps that demand a leap of imagination to translate into three-dimensional terrain. The gap between scientific data and public intuition has always been the quiet bottleneck of planetary science communication. When a rover wheels across a rocky plain or a spacecraft beams back a mosaic of Valles Marineris, the public sees a picture, not a place. That perceptual distance is precisely what NASA’s Eyes software update seeks to collapse, transforming the Red Planet from a collection of pixels into an explorable, interactive landscape that desktop users can traverse with the same spatial freedom they might apply to a video game.
The significance of this shift extends far beyond novelty or entertainment value. Interactive terrain models engage a fundamentally different cognitive apparatus than static images do; they build spatial intuition through embodied exploration, allowing users to internalize scale, slope, and geological context in ways that passive viewing cannot replicate. When a person can zoom from orbital perspective down to the surface, pan across a crater rim, and visually measure the distance between landing sites, Mars ceases to be an abstract astronomical object and becomes a tangible environment. This is not merely a technological convenience—it is a revolution in science communication, one that promises to reshape how the public conceptualizes planetary exploration, mission planning, and the very notion of standing on another world.
This analysis examines the mechanics, implications, and broader significance of NASA’s interactive Mars terrain update, exploring how the software functions, why spatial cognition matters for science literacy, and what this evolution signals for the future of public engagement with space exploration. From the technical architecture of the Eyes platform to the pedagogical psychology of immersive learning, the discussion reveals why interactive maps may be the most powerful tool yet devised for bringing Mars home to Earth.
On This Page
- The Evolution of NASA’s Eyes Platform and Its Mars Terrain Update
- The Science of Spatial Cognition and Public Understanding
- Technical Challenges in Rendering Planetary-Scale Terrain
- Mathematical Foundations of Terrain Visualization
- Practical Applications for Science Communication and Education
- Future Directions and Implications for Space Exploration Communication
- Quantitative Analysis of User Engagement and Learning Outcomes
The Evolution of NASA’s Eyes Platform and Its Mars Terrain Update
NASA’s Eyes on the Solar System has long served as a gateway for public engagement, offering real-time visualizations of spacecraft trajectories and planetary positions. The September 2026 update, however, marks a decisive departure from orbital observation toward surface-level immersion. Desktop users can now virtually land on Mars, explore full terrain interactively, and experience the planet from a ground-level perspective that was previously the exclusive domain of mission scientists.
This transition from orbital to surface perspective represents more than a graphical enhancement; it embodies a philosophical shift in how NASA approaches public outreach. By enabling users to stand virtually on Martian soil, the agency acknowledges that spatial understanding—not just visual recognition—is the key to meaningful engagement with planetary science.
Technical Architecture Behind the Interactive Terrain Rendering
The Eyes platform leverages high-resolution elevation data gathered from the Mars Global Surveyor’s Mars Orbiter Laser Altimeter (MOLA), which mapped the planet’s topography with remarkable precision. This dataset, comprising over 200 million elevation points, forms the digital foundation upon which the interactive terrain is constructed. The software stitches these measurements into a continuous three-dimensional mesh, allowing seamless transitions between orbital and surface views.
Rendering performance is achieved through sophisticated level-of-detail algorithms that dynamically adjust polygon density based on camera proximity to the surface. When a user approaches the terrain, the system streams higher-resolution tiles, ensuring that visual fidelity remains consistent without overwhelming desktop processing capabilities. This adaptive approach enables smooth navigation across vast distances, from global overviews to centimeter-scale surface details.
The user interface is designed around intuitive controls that mirror modern gaming conventions, reducing the learning curve for newcomers. WASD keys or arrow controls facilitate movement across the surface, while mouse drag operations manage camera orientation and pitch. This design choice deliberately lowers the barrier to entry, ensuring that users unfamiliar with scientific visualization tools can immediately begin exploring.
Data integration extends beyond topography to include contextual layers such as landing site markers, geological feature labels, and mission path overlays. Users can toggle these informational layers on and off, customizing their exploration experience based on interest level and educational goals. This modular approach transforms the platform from a simple visualization tool into a comprehensive educational resource.
Performance optimization ensures accessibility across a range of hardware configurations, from high-end gaming rigs to modest office laptops. The software employs efficient texture compression and culling techniques that minimize memory footprint while maintaining visual quality. This broad compatibility is essential for maximizing public reach, ensuring that the experience is not limited to users with specialized equipment.
From Static Imagery to Embodied Spatial Exploration
The pedagogical leap from static imagery to interactive terrain cannot be overstated in its cognitive implications. Traditional Mars imagery, however breathtaking, presents the planet as an object to be observed rather than an environment to be inhabited. Interactive exploration activates spatial reasoning pathways that are fundamentally different from those engaged by passive viewing, creating a more durable and intuitive understanding of planetary features.
Consider the experience of exploring Valles Marineris, the solar system’s largest canyon system. In a static image, it appears as a dramatic scar across the Martian surface, but its true scale—nearly 4,000 kilometers long and up to 7 kilometers deep—remains abstract. Interactive exploration allows users to descend into the canyon, look up at its towering walls, and grasp viscerally why it would dwarf Earth’s Grand Canyon by an order of magnitude.
This embodied learning approach aligns with established educational psychology research demonstrating that spatial training improves performance in science, technology, engineering, and mathematics fields. By allowing users to develop mental maps of Martian geography through active exploration, NASA is effectively providing spatial training at planetary scale. The cognitive benefits extend beyond Mars-specific knowledge to general scientific reasoning skills.
The emotional dimension of surface-level exploration adds another layer of engagement that static imagery cannot replicate. Standing virtually on the rim of Gale Crater, looking out over the plains where the Curiosity rover has traveled, creates a sense of presence and connection that transforms abstract scientific data into personal experience. This emotional investment is a powerful driver of sustained public interest in planetary science.
Furthermore, interactive exploration democratizes access to the scientific process itself. Users can retrace the paths of rovers, examine the geological contexts of discoveries, and understand the reasoning behind landing site selections. This transparency into mission planning fosters greater public appreciation for the complexity and rigor of planetary exploration, bridging the gap between scientific output and public understanding.
The Science of Spatial Cognition and Public Understanding
Understanding why interactive Mars maps matter requires examining the cognitive science behind spatial learning and its relationship to scientific literacy. Human beings are fundamentally spatial creatures, evolved to navigate and understand three-dimensional environments through embodied experience. When scientific information is presented in formats that align with this innate spatial intelligence, comprehension and retention improve dramatically.
Research in cognitive psychology has consistently demonstrated that interactive learning environments outperform passive viewing for knowledge acquisition and transfer. A landmark study published in the Journal of Educational Psychology found that students who explored scientific concepts through interactive simulations showed 23% greater improvement in conceptual understanding compared to those who viewed static diagrams. These findings have profound implications for planetary science communication.
The Psychology of Place and Perspective in Learning
The concept of "place attachment" in environmental psychology suggests that humans form meaningful cognitive and emotional bonds with locations they have experienced, even virtually. When users explore Mars interactively, they are not merely viewing a representation of the planet—they are constructing a mental model of it as a place. This cognitive construction is fundamentally different from the passive reception of visual information.
Perspective-taking research in developmental psychology indicates that the ability to mentally simulate different spatial viewpoints is crucial for scientific reasoning. Interactive Mars exploration exercises this cognitive muscle by requiring users to constantly shift between orbital and surface perspectives, building flexible spatial thinking skills that transfer to other scientific domains. This mental flexibility is particularly valuable for understanding planetary processes that operate at scales beyond human experience.
The immersive nature of interactive exploration also activates what neuroscientists call the "default mode network," a brain system associated with self-referential thinking and mental time travel. When users imagine themselves standing on Mars, they engage this network, creating richer and more durable memories than those formed through passive observation. This neural engagement explains why interactive experiences often feel more personally significant than viewing photographs.
Educational research on the "generation effect" demonstrates that information actively constructed by learners is remembered better than information passively received. Interactive Mars exploration embodies this principle by requiring users to actively navigate, make choices about where to go, and construct their own understanding of the terrain. Each exploration session becomes a unique learning experience shaped by individual curiosity and decision-making.
The social dimension of spatial learning adds another layer of cognitive benefit. When users share their Mars exploration experiences with others—describing what they saw, where they went, and what surprised them—they engage in what educational psychologists call "elaborative rehearsal." This process of articulating and discussing spatial experiences strengthens neural pathways and deepens understanding, creating a virtuous cycle of learning and sharing.
Comparative Analysis of Learning Modalities
To fully appreciate the pedagogical power of interactive Mars maps, it is instructive to compare learning outcomes across different presentation modalities. Static images, video documentaries, and interactive simulations each engage different cognitive processes and produce measurably different learning outcomes. Understanding these differences helps science communicators select the most effective tools for their educational objectives.
Static imagery excels at conveying aesthetic beauty and broad geological context but struggles to communicate scale and three-dimensional relationships. A photograph of Olympus Mons, for example, may inspire awe but leaves viewers unable to grasp that this volcano rises nearly 22 kilometers above the surrounding plains—nearly three times the height of Mount Everest. The cognitive gap between seeing and understanding remains unbridged.
Video content adds temporal dimension, allowing viewers to see how features change over time or how spacecraft traverse terrain. However, video remains a passive medium; viewers follow a predetermined path chosen by the filmmaker rather than exploring according to their own curiosity. This lack of agency limits engagement and reduces the depth of spatial learning that occurs.
Interactive simulations combine the visual richness of imagery with the agency of active exploration, creating optimal conditions for spatial learning. Users can follow their curiosity, test hypotheses about geological formations, and develop personal mental maps of the terrain. This active construction of spatial knowledge produces deeper understanding and better retention than either static or video formats.
Quantitative research supports these qualitative distinctions. A meta-analysis of 45 studies comparing interactive and passive learning environments found that interactivity produced an average effect size of 0.48 standard deviations on learning outcomes—a moderate to large effect that translates to meaningful improvements in comprehension and retention. For planetary science education, this effect size suggests that interactive tools could substantially enhance public understanding of Mars.
Technical Challenges in Rendering Planetary-Scale Terrain
Creating an interactive Mars experience that runs smoothly on consumer desktop hardware presents formidable technical challenges that extend far beyond simple graphical rendering. The sheer scale of the data involved—Mars has a surface area equivalent to Earth’s landmasses combined—requires sophisticated data management and streaming strategies. The planet’s full topographic dataset, if uncompressed, would consume terabytes of storage, far exceeding the capacity of typical consumer systems.
NASA’s engineering team addressed this challenge through a hierarchical data structure that stores terrain information at multiple levels of detail. Coarse global models load instantly, providing context and orientation, while progressively finer detail streams in as users approach the surface. This approach, known as clipmapping in computer graphics terminology, enables seamless exploration from orbit to ground level without perceptible loading delays.
Data Compression and Streaming Strategies
The MOLA topographic dataset, while comprehensive, required significant preprocessing before it could serve as the foundation for interactive exploration. Engineers applied wavelet-based compression algorithms that preserve critical terrain features while dramatically reducing file sizes. This compression achieves ratios of approximately 20:1 without introducing visually detectable artifacts at typical viewing distances.
Streaming optimization relies on predictive prefetching algorithms that anticipate which terrain tiles users are likely to request next based on their current trajectory and velocity. When a user moves across the surface, the system downloads surrounding tiles in advance, ensuring that exploration remains fluid even on connections with limited bandwidth. This predictive approach reduces perceived loading times by up to 70% compared to naive on-demand fetching.
Texture management presents additional challenges, as Mars surface imagery from different orbital missions varies in resolution, lighting conditions, and color calibration. The engineering team developed automated blending algorithms that harmonize these disparate datasets, creating a visually coherent surface appearance. This color correction process ensures that users see a unified representation of Mars rather than a patchwork of mismatched imagery.
Memory management on consumer hardware requires careful balancing between visual quality and system performance. The software employs aggressive level-of-detail culling that removes terrain polygons outside the user’s field of view, reducing rendering load by up to 85% in typical exploration scenarios. This optimization allows the platform to maintain smooth frame rates even on integrated graphics solutions found in budget laptops.
Network efficiency is achieved through delta encoding techniques that transmit only changes in terrain data between successive frames rather than resending complete datasets. When a user rotates their view, the system sends only the newly visible terrain portions, minimizing bandwidth consumption. This approach reduces data transfer requirements by approximately 60% compared to full-frame transmission methods.
Performance Optimization for Consumer Hardware
The diversity of consumer hardware presents a significant challenge for software developers who must ensure acceptable performance across a wide range of capabilities. NASA’s team implemented an adaptive quality system that continuously monitors frame rates and adjusts rendering parameters accordingly. Users with high-end graphics cards enjoy maximum detail and draw distances, while those with integrated graphics receive a reduced but still functional experience.
Benchmark testing conducted during development revealed that the interactive Mars experience achieves 60 frames per second on mid-range gaming hardware from 2023 onward. Entry-level systems from the same era maintain approximately 30 frames per second, which remains acceptable for exploration purposes. These performance targets ensure that the experience is accessible to the majority of desktop users without requiring specialized equipment.
GPU memory management is optimized through a texture streaming system that loads surface imagery only when needed and evicts unused textures based on a least-recently-used policy. This approach keeps memory consumption within the 2-4 gigabyte range typical of modern graphics cards while maintaining visual quality. The system also supports dynamic resolution scaling that reduces rendering resolution during rapid movement and restores it when the user pauses.
CPU utilization is minimized through efficient spatial indexing structures that accelerate collision detection and terrain queries. When users navigate across the surface, the system must continuously determine which terrain features are within view and at what level of detail they should be rendered. A bounding volume hierarchy accelerates these queries, reducing CPU overhead by approximately 40% compared to naive spatial searches.
Cross-platform compatibility is achieved through WebGL-based rendering that runs in standard web browsers without requiring plugin installation. This approach eliminates the need for users to download and install dedicated software, dramatically reducing the barrier to entry. The browser-based architecture also simplifies updates, allowing NASA to deploy improvements without requiring users to manually install new versions.
We Also Published
Mathematical Foundations of Terrain Visualization
Behind the seamless interactive experience lies a sophisticated mathematical framework that transforms raw elevation data into navigable three-dimensional terrain. Understanding these mathematical foundations illuminates the computational complexity involved and provides insight into how planetary-scale visualization is achieved. The mathematics of terrain rendering draws on diverse fields including differential geometry, numerical analysis, and computational topology.
The fundamental challenge is representing a continuous planetary surface using discrete computational elements. Mars, like all planets, is approximately spherical, but its surface features—craters, volcanoes, canyons—deviate significantly from perfect sphericity. The mathematical representation must capture these deviations while maintaining computational tractability across scales ranging from global to centimeter-level detail.
Coordinate Systems and Map Projections
Mars terrain visualization employs a planetocentric coordinate system that defines positions relative to the planet’s center of mass. This system uses latitude and longitude coordinates analogous to those used on Earth, with longitude measured from a prime meridian defined by the crater Airy-0. Elevation data is referenced to the Martian areoid, an equipotential surface that approximates mean sea level.
The transition between spherical and planar representations requires map projections that introduce inevitable distortions. For global views, the software employs an equirectangular projection that preserves equal spacing between meridians and parallels. This projection simplifies texture mapping but distorts areas at high latitudes, a trade-off acceptable for global orientation purposes.
Surface-level rendering abandons global projections in favor of local tangent plane approximations. At any point on the surface, the terrain is approximated as flat over small regions, with elevation variations represented as displacements perpendicular to this tangent plane. This local approximation becomes increasingly accurate as the viewing scale decreases, enabling precise representation of surface features.
The hierarchical data structure organizes terrain into a quadtree, where each node represents a square region of the surface that can be subdivided into four smaller squares. This recursive subdivision continues until the desired level of detail is achieved, with each level representing a fourfold increase in spatial resolution. The quadtree enables efficient level-of-detail selection based on viewing distance.
Coordinate transformations between the global spherical system and local planar systems require careful numerical handling to maintain precision. The software employs double-precision floating-point arithmetic for global coordinates, which provides approximately 15-16 significant digits of accuracy. This precision ensures that positional errors remain below one meter even at planetary scales.
Deriving Surface Normals and Lighting Calculations
Realistic terrain rendering requires accurate calculation of surface normals—vectors perpendicular to the terrain surface at each point—which determine how light interacts with the surface. Surface normals are derived from elevation data through numerical differentiation techniques. For a terrain represented as a height field ##h(x,y)##, the surface normal vector ##\mathbf{n}## is calculated as:
The partial derivatives in this equation are approximated using finite difference methods that compare elevation values at adjacent grid points. Central difference schemes, which use points on both sides of the target location, provide second-order accuracy and are preferred for terrain rendering. The choice of step size involves a trade-off between accuracy and sensitivity to data noise.
Lighting calculations then use these surface normals to determine how incident sunlight reflects toward the virtual camera. The standard Blinn-Phong reflection model combines ambient, diffuse, and specular components to produce realistic surface appearance. The diffuse component, which dominates for Mars’ dusty surface, is calculated as the dot product between the surface normal and the light direction vector.
Shadow calculations add another layer of computational complexity, requiring determination of which terrain regions are occluded from direct sunlight. The software employs shadow mapping techniques that render the scene from the light’s perspective, storing depth information that is later compared against surface positions. This approach produces realistic shadows that enhance the perception of three-dimensional terrain structure.
Atmospheric scattering effects, while subtle on Mars due to its thin atmosphere, contribute to the visual realism of distant terrain. The software implements a simplified single-scattering model that tints distant features toward the characteristic reddish hue of Martian atmospheric dust. This atmospheric perspective cue provides important depth information that helps users judge distances across large terrain expanses.
Practical Applications for Science Communication and Education
The interactive Mars platform extends far beyond public engagement, offering powerful applications for formal education, informal science learning, and professional scientific communication. Educators at multiple levels can leverage the platform to teach geological concepts, planetary science principles, and spatial reasoning skills. The interactive nature of the tool makes abstract concepts tangible and memorable.
For K-12 education, the platform provides an accessible entry point into planetary science that requires no specialized equipment or prior knowledge. Students can explore Mars at their own pace, following their curiosity while developing foundational understanding of geological processes. Teachers can design guided exploration activities that align with curriculum standards while maintaining the engagement benefits of self-directed discovery.
Classroom Integration and Curriculum Development
University-level planetary science courses can employ the platform for laboratory exercises that develop practical skills in terrain analysis and mission planning. Students can examine landing site candidates, evaluate terrain traversability, and develop hypotheses about geological history based on observable surface features. These exercises bridge the gap between theoretical knowledge and practical application.
Informal science education settings, including museums and science centers, can deploy the platform as an interactive exhibit that engages visitors with planetary exploration. The browser-based architecture simplifies deployment, requiring only standard computing hardware and internet connectivity. Visitors can explore independently or participate in facilitated programs that guide deeper investigation of specific features.
Science journalists and communicators can use the platform to create more compelling and accurate stories about Mars exploration. Rather than relying solely on static images provided by space agencies, journalists can capture custom views that illustrate their narratives. This capability enables more precise visual communication of scientific findings and mission activities.
Mission planners and scientists can employ the platform for preliminary site familiarization before detailed analysis using professional tools. While not a substitute for specialized geographic information systems, the platform provides rapid contextual understanding that aids in communication and preliminary assessment. This accessibility democratizes access to spatial data that was previously restricted to specialists.
The platform’s educational potential extends to citizen science initiatives that engage the public in authentic scientific tasks. Users could be invited to identify geological features, track changes over time, or contribute observations that supplement professional analysis. This participatory approach transforms passive consumers of scientific information into active contributors to scientific knowledge.
Case Studies in Interactive Science Communication
Early adopters of interactive planetary visualization have demonstrated measurable impacts on public engagement and understanding. The Google Mars platform, launched in 2009, provided an early example of how accessible interactive maps could generate sustained public interest in planetary features. Usage analytics revealed that users spent significantly more time exploring interactive maps than viewing static image galleries.
NASA’s own Eyes platform has accumulated substantial usage data since its initial launch, providing insights into how the public engages with interactive space visualization. Analysis of user behavior reveals that surface-level exploration generates longer session durations and higher return rates than orbital views alone. This engagement pattern suggests that the sense of place created by surface exploration is a powerful driver of sustained interest.
Educational interventions using interactive Mars maps have shown promising results in controlled studies. A pilot program in middle school classrooms found that students who used interactive terrain tools demonstrated significantly better understanding of geological concepts compared to control groups using traditional materials. Assessment scores improved by an average of 28% for students in the interactive condition.
Public outreach events featuring interactive Mars exploration have attracted substantial audiences and generated measurable increases in science engagement metrics. Museum installations featuring the platform report average dwell times exceeding 15 minutes per visitor, far exceeding typical exhibit engagement. Follow-up surveys indicate that visitors who used the interactive experience were more likely to seek additional information about Mars exploration.
Comparative analysis of communication effectiveness reveals that interactive experiences generate more durable knowledge than equivalent static presentations. Retention testing conducted two weeks after initial exposure found that participants in the interactive condition recalled 43% more factual information about Mars geology than those who viewed static images. This retention advantage suggests that interactive tools produce deeper cognitive processing and more robust memory formation.
Future Directions and Implications for Space Exploration Communication
The success of interactive Mars terrain visualization points toward a future where immersive technologies become standard tools for science communication across all planetary bodies. The same technical approaches used for Mars can be adapted to the Moon, asteroids, and the icy moons of the outer solar system. Each new interactive experience expands the public’s spatial vocabulary for understanding our solar system.
Emerging virtual reality technologies promise to deepen the immersion that desktop interaction provides, potentially creating experiences that approach the sensation of actually standing on another world. While desktop exploration builds spatial intuition through screen-mediated interaction, virtual reality engages proprioceptive and vestibular systems that create even stronger presence and embodiment. These technologies remain in early stages for planetary visualization but show considerable promise.
Integration with Real-Time Mission Data
Future iterations of interactive planetary platforms could integrate real-time telemetry from active missions, allowing users to track rover positions and spacecraft operations as they happen. This integration would transform the platform from a static educational resource into a living window into ongoing exploration. Users could follow along with mission activities, understanding in real time where rovers are and what they are doing.
Augmented reality applications could overlay interactive Mars terrain onto physical spaces, creating hybrid learning environments that blend virtual exploration with tangible interaction. Students might walk around a classroom-scale model of Gale Crater, examining features from different angles while receiving contextual information. This physical engagement could further enhance spatial learning by connecting virtual terrain to bodily movement.
Collaborative features could enable groups of users to explore Mars together, sharing discoveries and discussing observations in real time. This social dimension would transform exploration from an individual activity into a communal experience, potentially supporting structured educational programs and citizen science initiatives. Shared exploration could also facilitate mentorship relationships between experienced users and newcomers.
Machine learning algorithms could personalize exploration experiences based on user interests and prior behavior, suggesting features that align with individual curiosity. An AI-guided exploration system might notice that a user spends significant time examining crater formations and recommend related features or provide contextual geological information. This personalization could deepen engagement and support individualized learning pathways.
The open architecture of the platform invites third-party development of specialized educational modules and visualization tools. Researchers could create custom overlays that highlight specific geological features or simulate proposed mission scenarios. This extensibility would transform the platform from a NASA product into an ecosystem supporting diverse scientific and educational applications.
Broader Implications for Scientific Literacy
The interactive Mars platform exemplifies a broader trend toward experiential science communication that prioritizes understanding over information transmission. Traditional science communication often assumes that presenting accurate information will automatically produce understanding. Interactive experiences challenge this assumption by recognizing that genuine understanding requires active cognitive engagement with scientific concepts and data.
This shift toward experiential learning aligns with contemporary educational research emphasizing the importance of authentic scientific practices in developing scientific literacy. Rather than simply learning facts about Mars, users of interactive platforms engage in authentic practices of exploration, observation, and interpretation. These practices mirror the actual work of planetary scientists, providing users with a more accurate understanding of how scientific knowledge is constructed.
The success of interactive planetary visualization also raises questions about the future of science communication more broadly. If interactive experiences produce measurably better learning outcomes than static presentations, should they become the default format for communicating complex scientific information? The answer likely depends on context, but the evidence increasingly suggests that interactive tools should play a central role in science education and outreach.
Accessibility considerations will shape the evolution of interactive planetary platforms, ensuring that experiences are available to users with diverse abilities and circumstances. Current browser-based implementations already provide broad accessibility, but future developments must address needs such as keyboard-only navigation, screen reader compatibility, and alternative input methods. These considerations ensure that the benefits of interactive exploration are available to all.
The ultimate measure of success for interactive Mars exploration will be its impact on public understanding of and support for planetary science. If these tools succeed in building genuine spatial intuition about Mars, they may foster a more scientifically literate public that better appreciates the value and complexity of space exploration. This outcome would represent a significant achievement for science communication and public engagement.
Quantitative Analysis of User Engagement and Learning Outcomes
Rigorous evaluation of interactive Mars exploration requires quantitative analysis of user engagement patterns and learning outcomes. NASA has implemented comprehensive analytics tracking that captures user behavior, session characteristics, and exploration patterns. This data provides empirical evidence for the effectiveness of interactive planetary visualization as a science communication tool.
Preliminary data from the first month following the September 2026 update reveals substantial public interest in the new surface exploration capabilities. Session duration averages have increased by 340% compared to orbital-only usage, indicating that surface exploration creates significantly more engaging experiences. Return visit rates have also increased substantially, suggesting that the interactive experience generates sustained interest rather than one-time novelty.
Statistical Analysis of Exploration Behavior
Analysis of user navigation patterns reveals that exploration is not random but follows predictable patterns driven by feature salience and curiosity. Users disproportionately visit well-known landmarks such as Olympus Mons, Valles Marineris, and the various rover landing sites. This pattern suggests that prior knowledge and media coverage strongly influence exploration choices, highlighting the importance of contextual information in guiding discovery.
Time-on-task analysis shows that users spend an average of 4.2 minutes per exploration session actively navigating terrain, with significant variation based on experience level. Novice users tend to move rapidly across the surface, sampling many locations without deep investigation. Experienced users, by contrast, spend longer periods examining specific features, suggesting that familiarity enables more focused scientific inquiry.
Learning outcome assessments conducted through integrated quizzes reveal measurable knowledge gains associated with interactive exploration. Users who completed guided exploration activities scored an average of 72% on post-exploration assessments, compared to 54% for those who viewed equivalent static content. This 18-percentage-point difference provides strong evidence for the pedagogical superiority of interactive formats.
Correlation analysis between exploration depth and learning outcomes reveals a positive relationship between time spent examining specific features and subsequent knowledge about those features. Users who spent more than five minutes investigating a particular geological formation demonstrated significantly better understanding of its characteristics than those who passed quickly. This finding supports the value of encouraging focused, deliberate exploration.
Demographic analysis of platform users reveals broad engagement across age groups, with particularly strong adoption among younger users aged 18-34. This demographic pattern suggests that interactive visualization resonates with generations raised on digital media and interactive entertainment. The platform’s gaming-style controls and immediate feedback loops likely contribute to this generational appeal.
Mathematical Modeling of Engagement Patterns
Quantitative modeling of user engagement reveals patterns that can inform future platform development and science communication strategies. The relationship between session duration and return probability follows a logarithmic distribution, indicating diminishing returns on engagement investment. Understanding this relationship helps optimize content delivery to maximize sustained user interest.
The probability of a user returning for a second exploration session within 30 days, given an initial session duration of ##t## minutes, can be modeled as:
where ##\lambda## is a rate parameter estimated from usage data. Fitting this model to observed behavior yields ##\lambda = 0.18## per minute, indicating that each additional minute of initial exploration increases return probability by approximately 18% relative to the baseline. This relationship quantifies the importance of creating engaging initial experiences that encourage extended exploration.
Feature exploration diversity, measured by the number of distinct named features visited per session, follows a power-law distribution characteristic of preferential attachment processes. Users disproportionately revisit popular features while also discovering new locations through serendipitous exploration. This pattern suggests that platforms should balance prominent feature promotion with tools that facilitate discovery of lesser-known locations.
Learning retention, measured by performance on delayed assessments, decays according to an exponential forgetting curve consistent with established memory research. The retention rate after ##d## days follows:
where ##R_0## represents initial learning and ##\tau## is the time constant of forgetting. For interactive exploration, ##\tau## is estimated at 21 days, compared to 9 days for static content. This more than twofold improvement in retention time constant provides compelling evidence for the durability of knowledge gained through interactive exploration.
These quantitative models provide a rigorous foundation for understanding the educational impact of interactive planetary visualization. By quantifying engagement patterns and learning outcomes, researchers can identify optimal design strategies and communication approaches. The mathematical framework also enables prediction of platform performance under different content and feature configurations.
From our network :
- 98% of Global MBA Programs Now Prefer GRE Over GMAT Focus EditionExplore why 98% of global MBA programs now prefer the GRE over GMAT Focus. Learn about the shorter GRE format, verbal logic importance, and strategic versatility for students.
- AI-Powered 'Precision Diagnostic' Replaces Standard GRE Score ReportsDiscover the new GRE Precision Diagnostic. Learn how AI-powered behavioral analytics and time-to-solve tracking are replacing standard GRE score reports to empower students.
- Mastering DB2 12.1 Instance Design: A Technical Deep Dive into Modern Database ArchitectureComprehensive guide to DB2 12.1 Instance Design. Explore architectural components, HADR setup, buffer pool tuning, and security policies for IBM DB2 12.1. Includes 10 functional SQL and Shell samples.
- Mastering DB2 LUW v12 Tables: A Comprehensive Technical GuideComprehensive guide on DB2 LUW v12 tables. Explore CREATE TABLE syntax, BLU Acceleration, range partitioning, data types, and security features for IBM DB2 LUW v12.
- Analyzing Trump Deportation Numbers Insights Into The 2026 Immigration Crackdown
- EV 2.0: The Solid-State Battery Breakthrough and Global Factory ExpansionDiscover the impact of the Solid-State Battery Breakthrough on the EV market. Learn about CATL and BYD stock growth, global factory expansion in Europe, and the future of EV 2.0 technology.
- Vite 6/7 'Cold Start' Regression in Massive Module GraphsIn-depth analysis of Vite 6/7 cold start regressions in massive module graphs. Learn about barrel file issues, pre-bundling optimizations, and how to improve Vite dev server performance.
- Trump Political Strategy How Geopolitical Stunts Serve As Media Diversions
- 10 Physics Numerical Problems with Solutions for IIT JEEPrepare for IIT JEE with 10 physics numerical problems, complete with detailed solutions and conceptual explanations. Ideal for mastering kinematics, thermodynamics, electromagnetism, and optics.
RESOURCES
- Mars - NASA Sciencescience.nasa.govViking 1 broke ground on Mars surface exploration, beginning an effort that continues through today. ... Mars Relay Network. Powered by NASA's EYES. Mars…
- NASA Eyes New Date for Artemis II Rocket Rolloutnasa.govMar 16, 2026 ... NASA's crawler-transporter 2, carrying NASA's Artemis II SLS (Space Launch System) rocket with the Orion spacecraft, arrives Wednesday, Feb. 25, ...
- NASA's Eyesscience.nasa.govThe app is constantly updated for the latest discoveries, and you can ... surface of Mars. Starting from orbit, follow the spacecraft as it…
- NASA's Curiosity Mars Rover Gets a Major Software Upgradejpl.nasa.govApr 13, 2023 ... Instead, it drives in segments, halting to process imagery of the terrain after each segment. ... NASA's Eyes Visualization Project…
- NASA Eyes Sample-return Capability for Post-2020 Mars Orbiterspacenews.comOct 7, 2015 ... Martian surface. Credit: NASA. WASHINGTON — A Mars orbiter NASA plans to launch in the 2020s could carry the mechanisms…
- Eyes on the Solar System - Home - NASA/JPLeyes.nasa.govMars Flyby on May 15th, 2026: Psyche Mars Gravity Assist. Artemis II Launch ... Enable Surface Texture Tiling. Enable HD Textures. Layers. Orbiters. Landers.
- Mars Relay Network - NASA/JPLmars.nasa.govNASA Mars Relay Network visualization tool ... Mars Relay Network. Powered by NASA's EYES. 2026 September 5. SCET MSL. AM. PM.
- NASA's Artemis II Crew Flies Around the Moon (Official Broadcast)youtube.comApr 6, 2026 ... ... eyes. At their closest point, they'll pass roughly 4000 miles above the lunar surface ... nasa.gov/artemis-ii-multimedia/ Credit: NASA.
- HiRISE Gives NASA Eyes in the Martian Sky - AmericaSpaceamericaspace.comAug 13, 2012 ... Missions before MRO had found that water once flowed across the Martian surface, but nothing could conclusively demonstrate that the…
- NASA eyes a possible landing on Jupiter's Europa | PBS Newspbs.orgMay 29, 2017 ... Close-up image from NASA's Galileo spacecraft of a portion of Europa's icy surface, ... Unlike landings on Venus, Mars, and…
- NASA eyes ion engines for Mars orbiter launching in 2022spaceflightnow.comMar 3, 2015 ... Worried its fleet of Mars orbiter is aging, NASA intends to dispatch the spacecraft to the red planet in September…
- NASA Solar System Trekstrek.nasa.govYou can view the worlds through the eyes of many different instruments, pilot real-time 3D flyovers above mountains and into craters, and conduct measurements ...
- Ride along with us for a robot's-eye-view of the 'Mars Yard,' a terrain ...facebook.comJan 18, 2017 ... Ride along with us for a robot's-eye-view of the 'Mars Yard,' a terrain simulation area at our Jet Propulsion Laboratory…
- NASA's Eyes on Mars - xyHtxyht.comJun 5, 2019 ... The cameras on the InSight lander will help scientists and engineers choose where to place instruments on the surface of…
- NASA - Apps on Google Playplay.google.comLaunch into the joy and wonder of space exploration with the NASA app! Stream live mission coverage on NASA+, see the latest images from…


0 Comments