You’re about to begin an exciting journey into the world of the coordinate plane—and don’t worry, it’s much less intimidating than it sounds! We’ll take it step by step, ensuring you understand the core concepts clearly before we move on to more advanced topics. By the end of this lesson, you’ll be confidently plotting points and navigating the coordinate plane with ease.
Table of Contents
- Understanding the Coordinate Plane
- Step 1: Identify the Ordered Pair
- Step 2: Locate the x-coordinate
- Step 3: Locate the y-coordinate
- Step 4: Plot the Point
- Examples of Plotting Points
- Example 1: Plotting (2, 3)
- Example 2: Plotting (-1, 4)
- Example 3: Plotting (-3, -2)
- Example 4: Plotting (4, -1)
- Special Cases: Points on the Axes
- Plotting Coordinate Points in 3D Space: Step-by-Step Guide
- Applications of Plotting Points
- Tips for Success
- Below are few additional problems similar to the above.
Understanding the Coordinate Plane
The Cartesian coordinate system is a fundamental mathematical framework used to represent and analyze positions and relationships in space. It provides a structured way to describe the location of points across multiple dimensions, using a set of perpendicular axes. Think of the coordinate plane as a map where every point has a unique address (x, y), allowing us to precisely locate and analyze various mathematical entities.
In two dimensions (2D), this system consists of the x-axis (horizontal) and y-axis (vertical), intersecting at a point called the origin. This setup divides the plane into four quadrants, numbered I through IV, allowing every point to be represented as an ordered pair ##(x,y)##.
Expanding into three dimensions (3D), a third axis — the z-axis — is introduced, perpendicular to both the x- and y-axes. The resulting space is divided into eight octants, and each point in this space is represented by an ordered triple ##(x,y,z)##. This allows for a more realistic and complex representation of spatial relationships, especially useful in physics, computer graphics, and engineering.
The Cartesian system can also be generalized to higher dimensions (nD), where each additional axis adds a new degree of freedom. Though difficult to visualize beyond three dimensions, higher-dimensional Cartesian spaces are vital in fields like data science, machine learning, and theoretical physics.
2-Dimensional Cartesian coordinate system
Each point on the coordinate plane is represented by an ordered pair (x, y). The x-coordinate (also called the abscissa) represents the horizontal distance from the origin, and the y-coordinate (also called the ordinate) represents the vertical distance from the origin. Positive x-values are to the right of the origin, while negative x-values are to the left. Positive y-values are above the origin, and negative y-values are below. The coordinate plane provides a visual representation of mathematical relationships, making it an essential tool in various fields, including algebra, geometry, and calculus.
Plotting Coordinate Points in 2-Dimensional Plane Step-by-Step Guide
Step 1: Identify the Ordered Pair
Before you can plot a point, you need an ordered pair (x, y). This pair tells you the location of the point on the coordinate plane. The first number in the pair is the x-coordinate, and the second number is the y-coordinate. For example, in the ordered pair (3, 4), the x-coordinate is 3, and the y-coordinate is 4. Always ensure you correctly identify the x and y values to avoid any plotting errors. This step is fundamental, as it sets the foundation for accurate Plotting Coordinate Points.
Step 2: Locate the x-coordinate
Start at the origin (0, 0). Move horizontally along the x-axis. If the x-coordinate is positive, move to the right; if it’s negative, move to the left. For example, if the x-coordinate is 3, move 3 units to the right of the origin. If the x-coordinate is -2, move 2 units to the left of the origin. Make sure you are on the correct x-axis value before proceeding to the next step. This step involves understanding the horizontal position of the point.
Step 3: Locate the y-coordinate
From the x-coordinate position, move vertically along the y-axis. If the y-coordinate is positive, move upwards; if it’s negative, move downwards. For example, if the y-coordinate is 4, move 4 units upwards from your x-coordinate position. If the y-coordinate is -1, move 1 unit downwards from your x-coordinate position. This movement is perpendicular to the x-axis, defining the vertical position of the point. The intersection of the horizontal and vertical movements is where you will plot your point.
Step 4: Plot the Point
The point where the horizontal and vertical movements intersect is where you plot the point. Draw a small dot at this intersection. Label the point with its ordered pair (x, y) to clearly identify it. Ensure the dot is clearly visible but not too large to obscure the coordinate values. This final step completes the process of Plotting Coordinate Points, providing a visual representation of the ordered pair on the plane. Practice this process repeatedly to master the skill.
Examples of Plotting Points
Example 1: Plotting (2, 3)
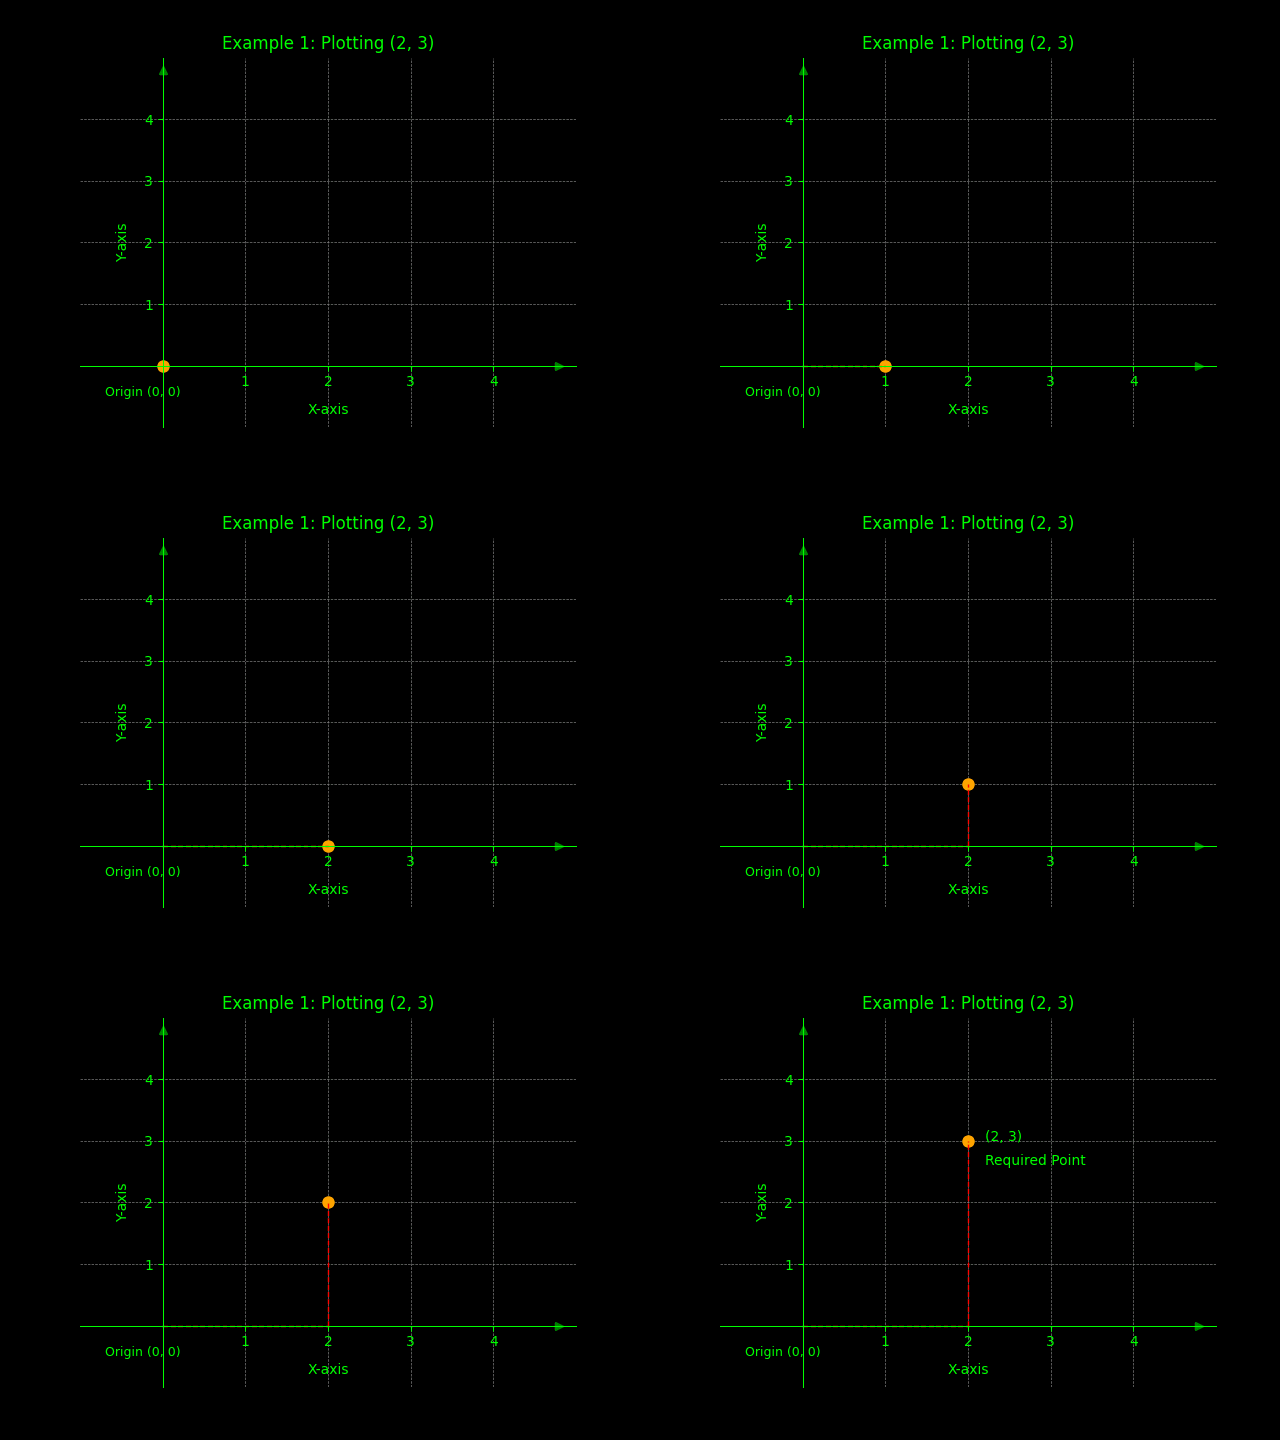
To plot the point (2, 3), start at the origin (0, 0). Move 2 units to the right along the x-axis (since the x-coordinate is positive 2). Then, move 3 units upwards along the y-axis (since the y-coordinate is positive 3). Plot a point at the intersection of these two movements. Label this point as (2, 3). This example illustrates the basic process of plotting a point in the first quadrant.
Visual Solution >
Example 2: Plotting (-1, 4)
To plot the point (-1, 4), start at the origin (0, 0). Move 1 unit to the left along the x-axis (since the x-coordinate is negative 1). Then, move 4 units upwards along the y-axis (since the y-coordinate is positive 4). Plot a point at the intersection of these two movements. Label this point as (-1, 4). This example demonstrates plotting a point in the second quadrant, where the x-coordinate is negative and the y-coordinate is positive.
Example 3: Plotting (-3, -2)
To plot the point (-3, -2), start at the origin (0, 0). Move 3 units to the left along the x-axis (since the x-coordinate is negative 3). Then, move 2 units downwards along the y-axis (since the y-coordinate is negative 2). Plot a point at the intersection of these two movements. Label this point as (-3, -2). This example shows plotting a point in the third quadrant, where both x and y coordinates are negative. These are some of the examples of Plotting Coordinate Points.
Example 4: Plotting (4, -1)
To plot the point (4, -1), start at the origin (0, 0). Move 4 units to the right along the x-axis (since the x-coordinate is positive 4). Then, move 1 unit downwards along the y-axis (since the y-coordinate is negative 1). Plot a point at the intersection of these two movements. Label this point as (4, -1). This example demonstrates plotting a point in the fourth quadrant, where the x-coordinate is positive and the y-coordinate is negative. Through these examples, you should have a good understanding of Plotting Coordinate Points.
Special Cases: Points on the Axes
Points on the x-axis
Points that lie on the x-axis have a y-coordinate of 0. Their ordered pairs are in the form (x, 0). For example, the point (5, 0) lies on the x-axis, 5 units to the right of the origin. The x-coordinate determines the point’s position along the x-axis, while the y-coordinate remains at zero. Understanding these points is crucial for accurate Plotting Coordinate Points and interpreting graphs.
Points on the y-axis
Points that lie on the y-axis have an x-coordinate of 0. Their ordered pairs are in the form (0, y). For example, the point (0, -3) lies on the y-axis, 3 units below the origin. The y-coordinate determines the point’s position along the y-axis, while the x-coordinate remains at zero. Recognizing these special cases helps in quickly identifying and plotting points that fall directly on either axis. These points are often used as reference points in various mathematical problems.
The Origin (0, 0)
The origin (0, 0) is the point where the x-axis and y-axis intersect. It serves as the central reference point for the coordinate plane. When plotting the origin, you simply place a point at the intersection of the two axes. This point is neither positive nor negative on either axis. It’s the starting point for all coordinate measurements. It is the basis for Plotting Coordinate Points. Some school of thoughts also denote this as “Neutral Junction”.
3-Dimensional Cartesian Coordinate System
Each point in 3D space is represented by an ordered triple (x,y,z)(x, y, z)(x,y,z).
- The x-coordinate (abscissa) represents the horizontal distance from the origin along the x-axis.
- The y-coordinate (ordinate) represents the depth or lateral distance along the y-axis, typically extending from front to back (or left to right, depending on orientation).
- The z-coordinate represents the vertical distance from the origin along the z-axis.
Positive values on each axis indicate movement in the positive direction of that axis:
- Positive x is to the right, negative x to the left.
- Positive y is forward (or rightward in some systems), negative y is backward (or leftward).
- Positive z is upward, negative z is downward.
Plotting Coordinate Points in 3D Space: Step-by-Step Guide
Step 1: Identify the Ordered Triple
To plot a point in 3D space, you need an ordered triple ##(x,y,z)##. For example, the point (3,−2,5) means:
- Move 3 units along the x-axis,
- -2 units along the y-axis,
- and 5 units along the z-axis.
Correctly identifying all three coordinates is crucial for accurate positioning in space.
Step 2: Locate the x-coordinate
Start at the origin ##(0,0,0)##.
Move along the x-axis:
- Rightward if the x-value is positive,
- Leftward if negative.
Pause at the x-coordinate before continuing.
Step 3: Locate the y-coordinate
From your current x-position, move along the y-axis:
- Forward (or right, depending on orientation) for positive values,
- Backward (or left) for negative values.
This gives the horizontal plane position of the point in the xy-plane.
Step 4: Locate the z-coordinate
Now, from the ##(x,y)## position in the base plane, move vertically along the z-axis:
- Upward for positive z-values,
- Downward for negative ones.
This final movement places the point precisely in 3D space.
Step 5: Plot the Point
The intersection of the x, y, and z movements defines the point’s location in space.
Mark the point and label it with its ordered triple ##(x,y,z)##.
If using software or graphing tools, 3D coordinate grids often help visualize depth and elevation, making plotting more intuitive.
With practice, plotting in 3D becomes a powerful skill for visualizing real-world data, shapes, and mathematical relationships in three-dimensional space.
Applications of Plotting Points
The ability to plot points on a coordinate plane is a fundamental skill with wide-ranging applications in various fields. In mathematics, it forms the basis for graphing linear equations, quadratic equations, and other functions. By plotting points, you can visualize the relationship between variables and understand the behavior of equations. This is essential for solving problems in algebra, calculus, and other advanced mathematical topics. The skill of Plotting Coordinate Points is also used in various other fields.
In science, plotting points is used to represent experimental data, create graphs, and analyze trends. Scientists use coordinate planes to visualize the relationship between different variables, such as temperature and pressure, or time and distance. This helps them identify patterns, make predictions, and draw conclusions from their experiments. Data visualization is a crucial skill in scientific research, and plotting points is a fundamental component of this process.
Beyond academics and science, plotting points is also used in real-world applications. In computer graphics, coordinate planes are used to create and manipulate images. In navigation, GPS systems use coordinate planes to determine and display locations. In finance, stock prices and market trends are often represented on coordinate planes. The skill of Plotting Coordinate Points is also used in cartography to create maps. The ability to plot points on a coordinate plane is a versatile skill with practical applications in numerous fields.
Tips for Success
To excel at Plotting Coordinate Points, practice regularly. The more you practice, the more comfortable and proficient you will become. Start with simple problems and gradually increase the complexity. Use graph paper or online graphing tools to visualize the points and check your work. This helps you identify and correct any errors in your understanding. Also, pay close attention to the signs of the coordinates (positive or negative) to ensure you are plotting the points in the correct quadrants.
Make sure you understand the relationship between the x-coordinate and the horizontal movement, and the y-coordinate and the vertical movement. This is the key to accurately plotting points. Create your own practice problems by choosing random ordered pairs and plotting them. This will help you reinforce your understanding and build confidence. Also, try to visualize the coordinate plane in your mind. This will help you plot points more quickly and accurately, even without graph paper.
Don’t be afraid to ask for help if you’re struggling. Consult with your teacher, classmates, or online resources for clarification. Review the examples and explanations provided in this guide. Remember, mastering this skill takes time and effort. With consistent practice and a clear understanding of the concepts, you can become proficient in plotting points on a coordinate plane. Remember, accuracy is key. Double-check your work and always label your points correctly. This will help you avoid common mistakes and build a strong foundation in mathematics.
Below are few additional problems similar to the above.
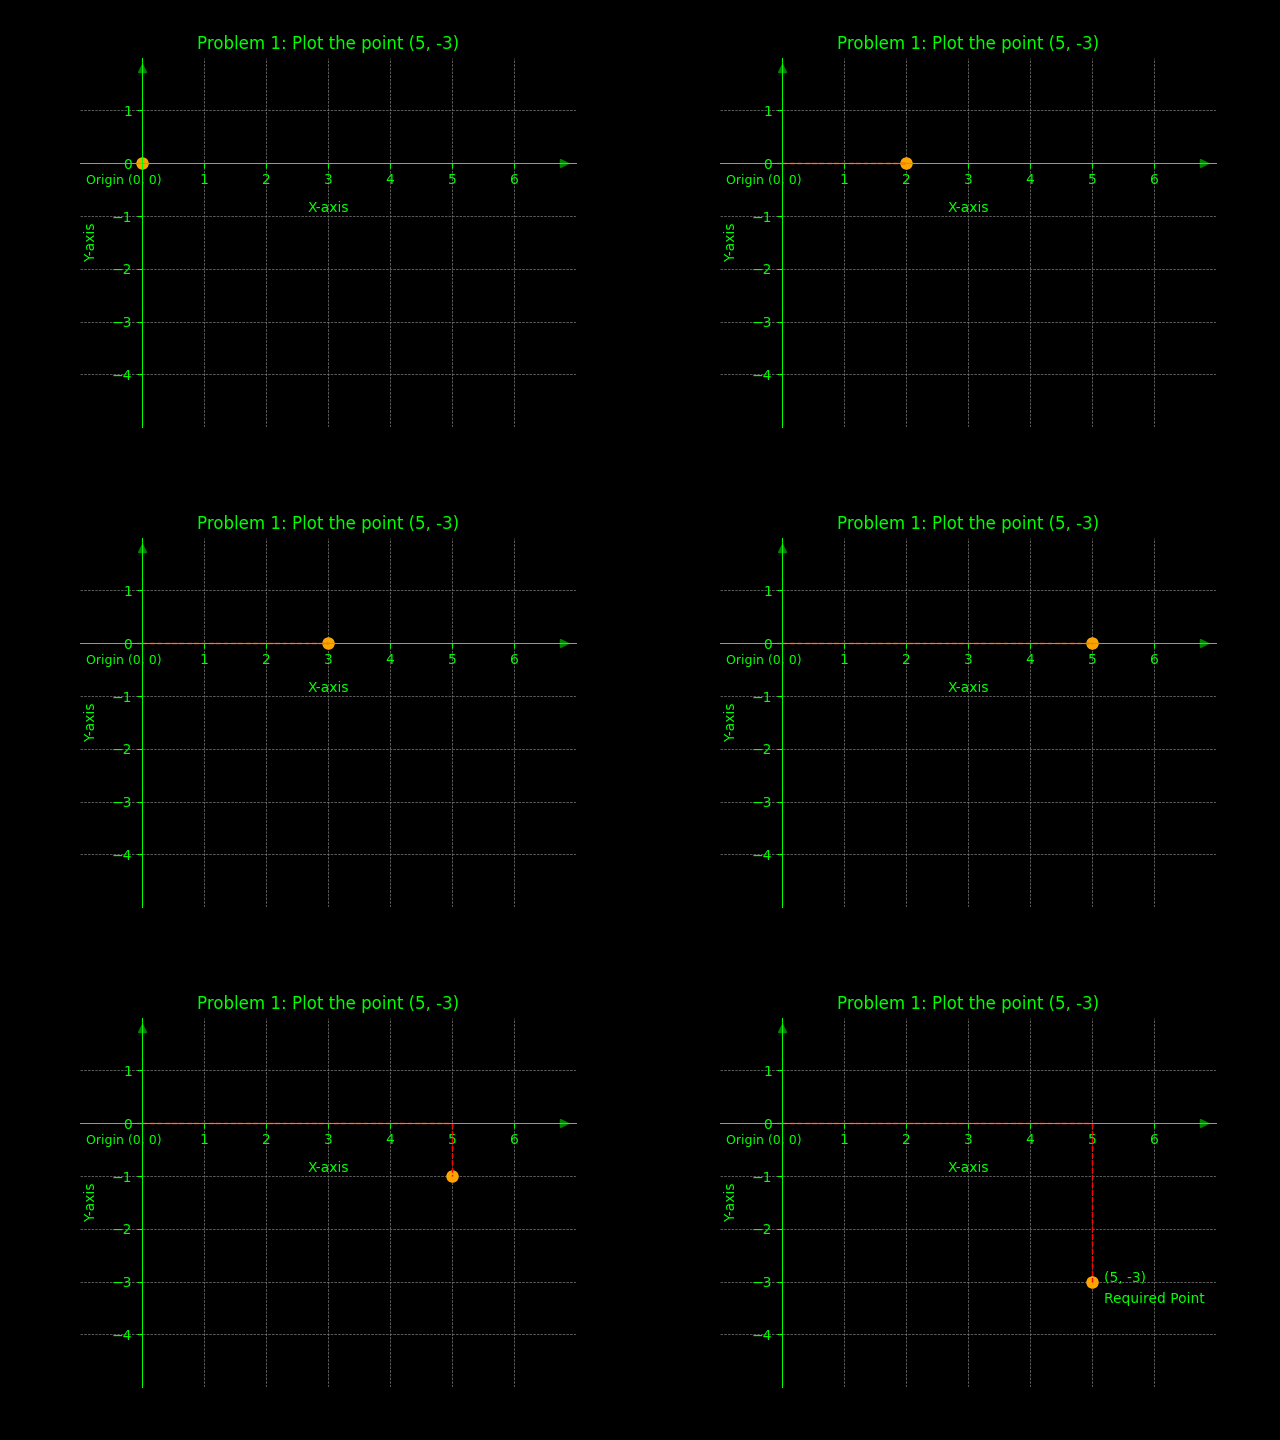
Problem 1: Plot the point (5, -3)
Solution: Move 5 units right and 3 units down from the origin.
Problem 1: Plot the point (5, -3, 4)
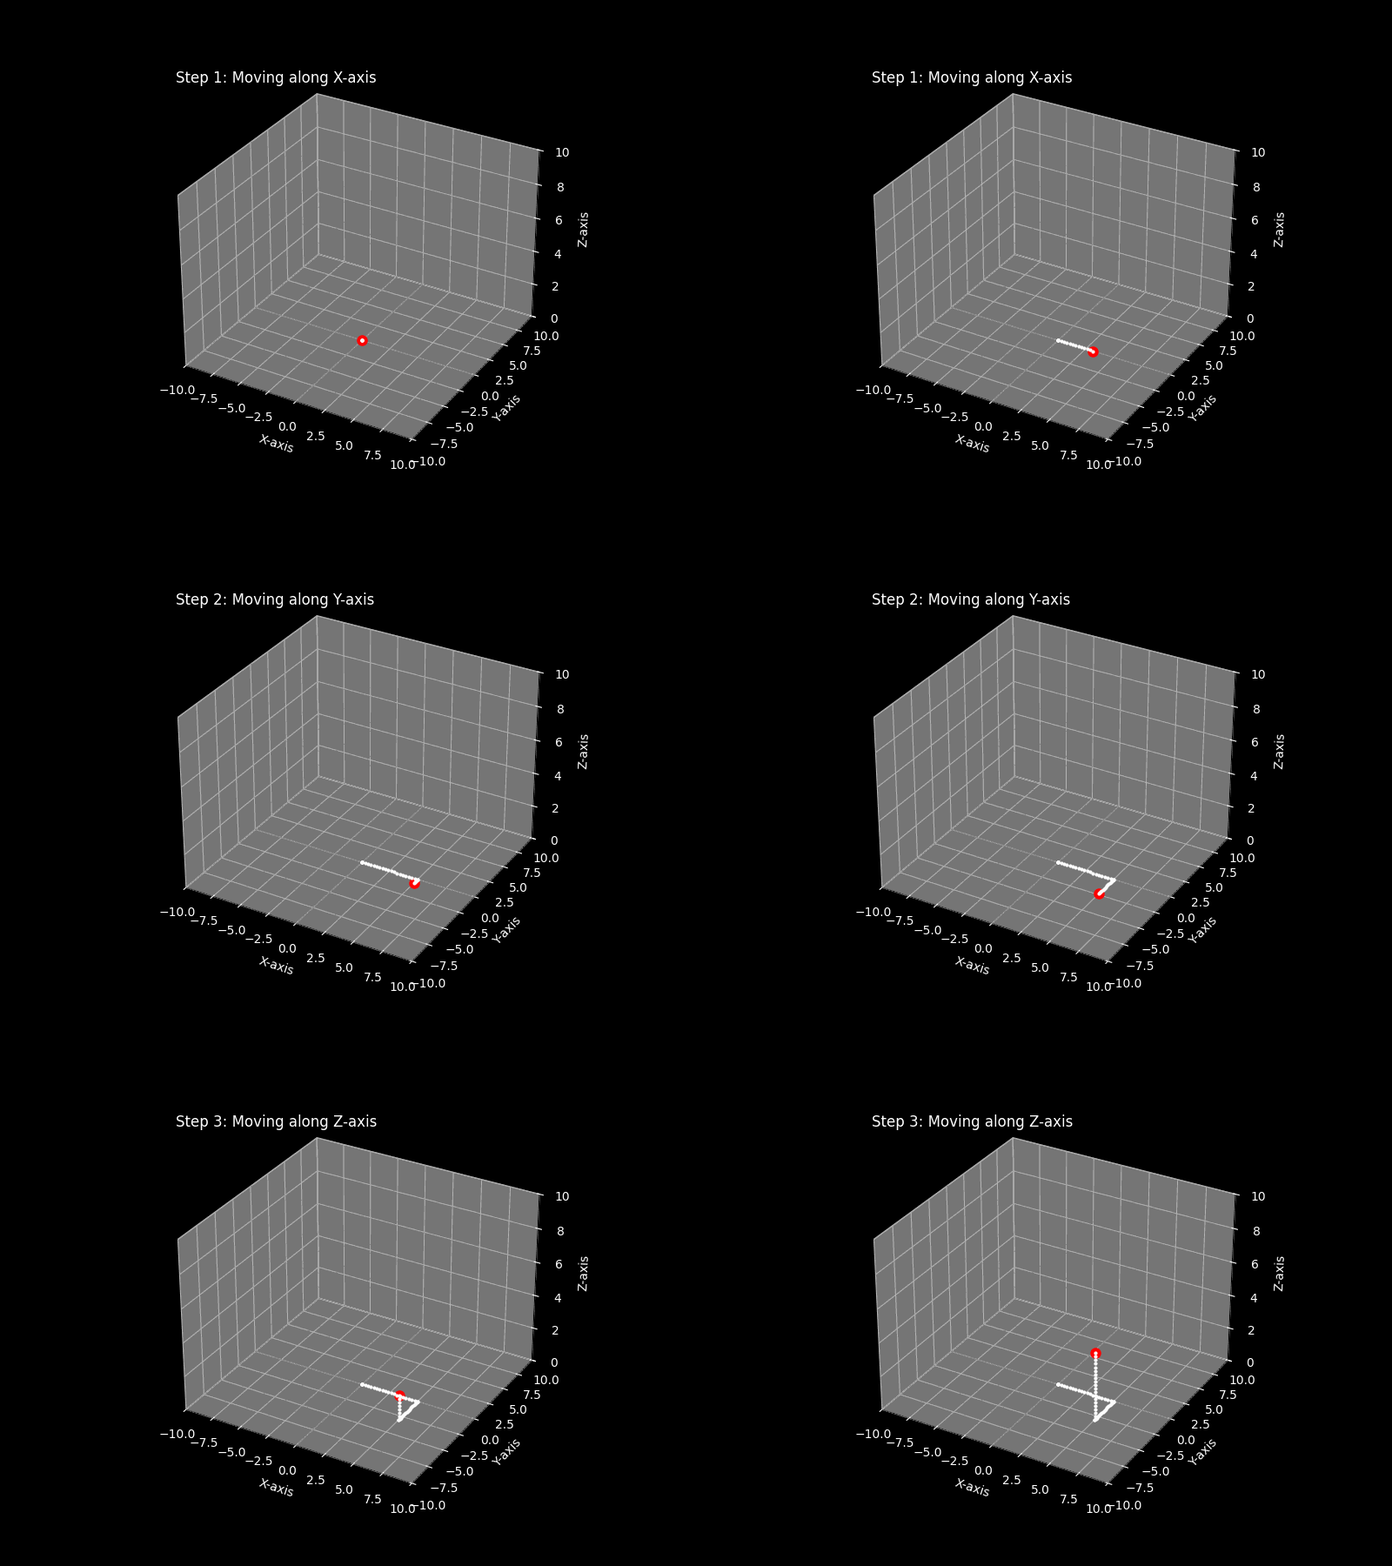
Use same approach for below problems
Problem 1: Plot the point (-4, 1)
Solution: Move 4 units left and 1 unit up from the origin.
Problem 2: Plot the point (0, -5)
Solution: Move 5 units down along the y-axis from the origin.
Problem 3: Plot the point (2, 2)
Solution: Move 2 units right and 2 units up from the origin.
Problem 4: Plot the point (-1, -1)
Solution: Move 1 unit left and 1 unit down from the origin.
RESOURCES
- How to Plot Points a Coordinate Plane | Positive and Negative …
- Plotting Coordinate Points (A)
- Plotting Points on a Coordinate Plane | All 4 Quadrants – YouTube
- Graph points on a coordinate plane | 5th grade math – IXL
- Plot Points | Desmos
- How to Plot and Label a Point in the Coordinate Plane | Algebra …
- Graph points on a coordinate plane | 6th grade math – IXL
- Graphing and Connecting Coordinate Points – Desmos Help Center
- Grade 5 Geometry Worksheets: Plotting points on a coordinate grid …
- 2.2: The Coordinate Plane – Mathematics LibreTexts



0 Comments